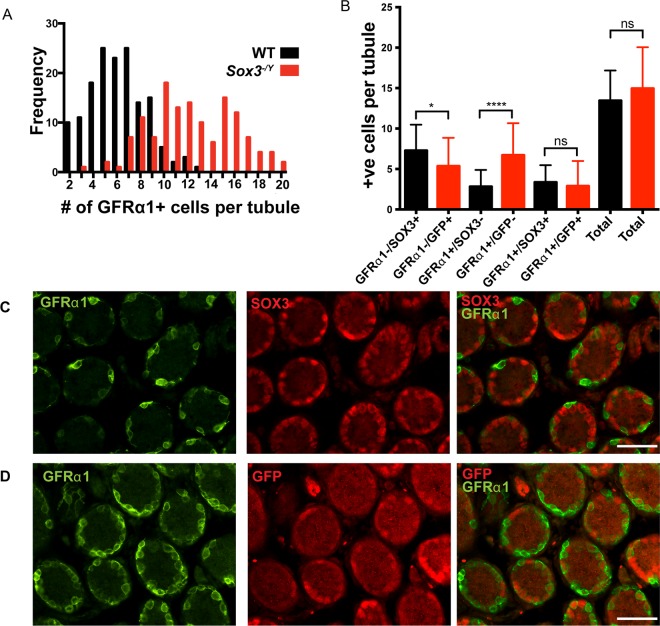
Figure 6.
Increased number of GFRα1+ spermatogonia in Sox3−/Y testis. (A) Frequency plot showing more GFRα1+ cells per tubule in Sox3 null testis cross-sections (12.3+/− 0.28) compared to WT (6.2+/−0.19), Ρ < 0.0001. (B) Cell counts of the different spermatogonia cell identities as marked by SOX3/GFP and or GFRα1 staining. IF of WT testis cross sections at P7 (C), and Sox3 null testis sections (D), staining for SOX3 (red) and GFRα1 (green). Minimum 10 fields of view per counted section, 3 sections per testis, n = 3 for each genotype, not significant (ns), Ρ < 0.05 (*), Ρ < 0.0001(****) as determined by Mann-Whitney test. Data represented as mean±s.d., scale bar is 50μm (C,D).

