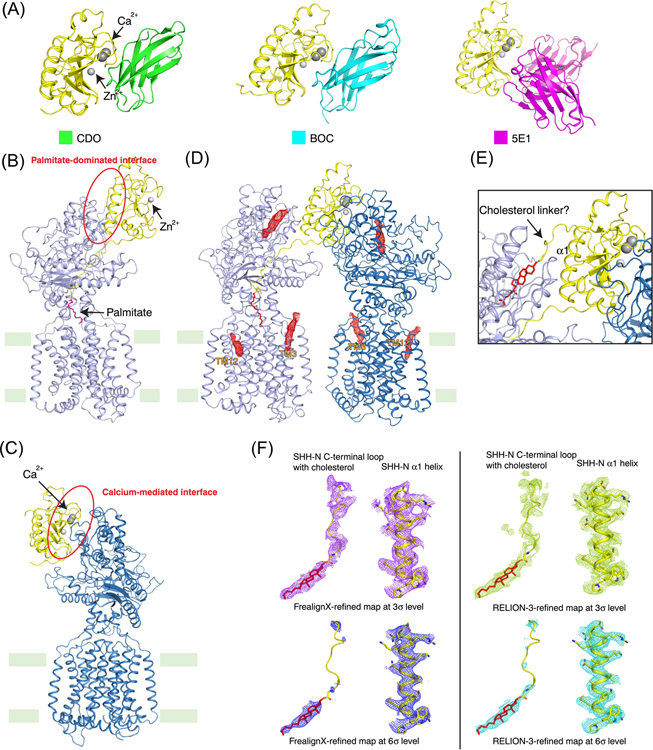
Figure 3. Structures of PTCH1–HH complexes.
(A) Structures of HH with CDO (PDB ID: 3D1M), BOC (PDB ID: 3N1M) and 5E1 antibody (PDB ID: 3MXW). CDO and BOC are HH-N co-receptors that up-regulate HH signaling; 5E1 down-regulates HH signaling. They bind HH-N via the calcium-mediated interface. (B) Structure of PTCH1 with native HH-N (PDB ID: 6OEV). At 1:1 molar ratio, the palmitate moiety of native HH-N inserts in to the ECDs of PTCH1, forming the palmitate-dominated interface. (C) Structure of PTCH1 with His-tagged HH-N (PDB ID: 6DMY). His-tagged HH-N lacks the palmitate modification and binds PTCH1 through the calcium-mediated interface in presence of Ca2+. (D) Structure of 2:1 PTCH-1 and native HH-N complex (PDB ID: 6E1H). PTCH1 and native HH-N were incubated at 2:1 molar ratio with 1 mM Ca2+. In this structure, native HH-N employs both interfaces to bind two PTCH1 molecules. The sterol-like molecules that are observed in the cryo-EM map shown in red mesh. They are located in both TMs and ECDs. (E) The potential insertion of cholesterol modification of HH-N into PTCH1 (PDB ID: 6RVD). The cholesterol modification of native HH-N may insert into the ECD-I of PTCH1, but further structural and functional data are needed to prove this hypothesis. (F) SHH-N C-terminal loop and cholesterol. The cryo-EM maps of the linker region between HH-N and its cholesterol modification that were refined by FrealignX or RELION-3 at different signal levels. Although the overall EM maps are almost the same, densities of the linker region are quite different due to refinements by different software. This suggests the densities at this region may not be suitable for building the structural model. The palmitate is shown in magenta sticks. Cholesterol is shown in red sticks. The calcium and zinc ions were shown in gray balls.

