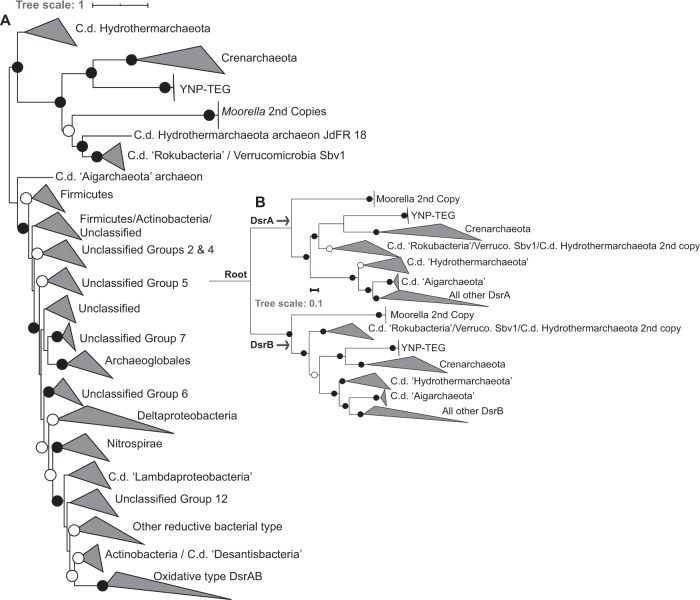
Fig. 3. Maximum-Likelihood phylogenetic reconstruction of YNP-TEG DsrAB subunit homologs.
a Unrooted phylogenetic reconstruction of a concatenated DsrAB alignment block (alignment length = 1230 positions, n = 1218 homolog pairs). The tree is displayed with an artificial midpoint-rooting visualization. Branches are identified according to major taxonomic/functional groups (following the classification scheme of [49]). Bootstrap values >90 for clade-level bifurcations are indicated by black circles while those between 50 and 90 are denoted by white circles. Values are not depicted for nodes with bootstrap support <50. Branch length is relative to the scale provided at the top indicating the expected number of substitutions per site. The clade-level triangles indicate the phylogenetic diversity within each group via side lengths that are proportional to the distances between the clade’s closest and furthest taxa. b Paralogous rooting of the DsrA (top) and DsrB (bottom) subunits using a subset of taxa (n = 62) from the major lineages shown in the more expansive phylogenetic analysis in a. Bootstrap values are depicted the same as in panel a. Branch length is relative to the scale provided at the left indicating the expected number of substitutions per site. The root is labeled where the DsrA/DsrB subunits are presumed to have originated by a gene duplication prior to expansion and radiation. The clade-level triangles indicate the phylogenetic diversity within each group via side lengths that are proportional to the distances between the clade’s closest and furthest taxa.

