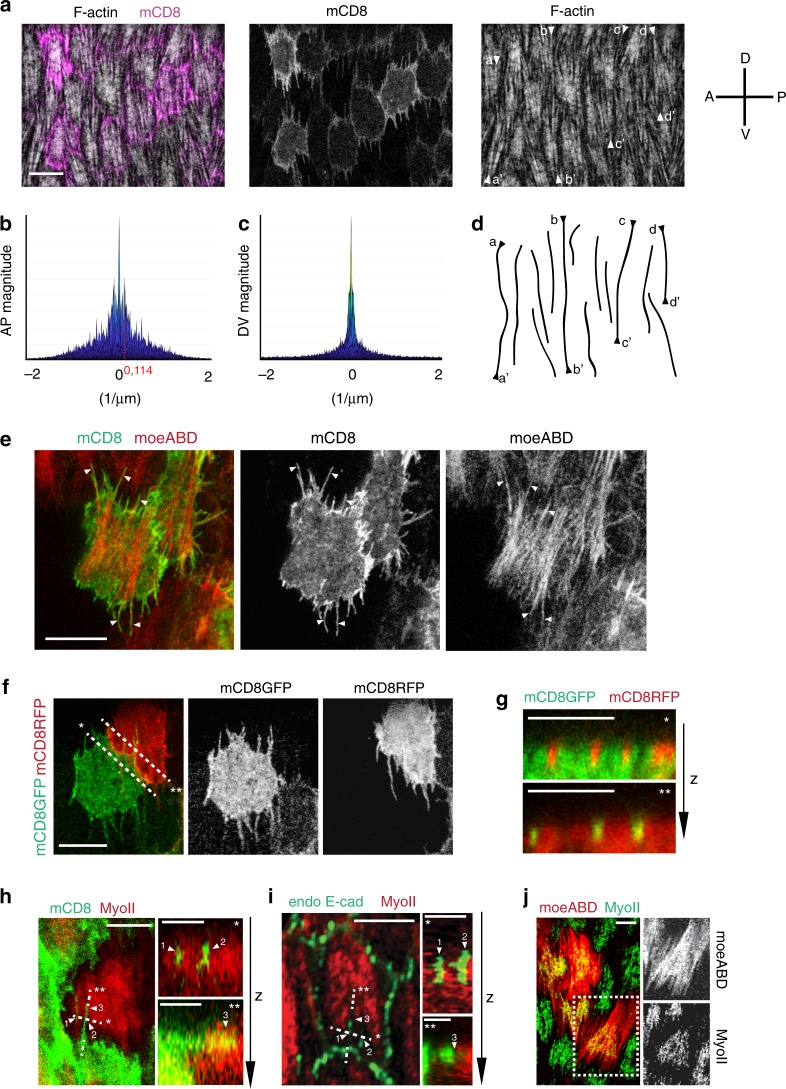
Fig. 1. Supracellular actin stress fibers emerge from interdigitating filopodia.
a Basal view of follicle cells at stage 10A (S10A), with stochastic induction of mCD8GFP expression (magenta). F-actin is marked by phalloidin staining. A-P and D-V indicate the anterior-posterior and ventral-dorsal axes. Arrow heads indicate the extremities of supracellular F-actin fiber patterns. b, c Fourier analysis of F-actin distribution along the AP (b) and DV (c) axes. d Lines corresponding to the supracellular F-actin fiber patterns indicated in a. e Basal view of follicle clone cells co-expressing mCD8GFP and moeABD-mCherry. Arrow heads indicate filopodia that radiate from the medial-basal stress fiber network. f Basal view of two follicle clone cells in contact, one marked with mCD8GFP and the other with mCD8RFP showing filopodia interdigitating. g Cross-sections of cells along the two dashed lines shown in f: filopodia marked by mCD8RFP insert into the mCD8GFP-expressing cell (*, top panel); filopodia marked by mCD8GFP insert into the mCD8RFP-expressing cell (**, bottom panel). The z-axis indicates the basal to apical direction. h Left panel: close-up view of intercellular filopodia from follicle clone cells with stochastic expression of mCD8GFP (green). MyoII (red) is visualized by using a MyoII-mCherry construct. Right panels: cross-sections along the two dashed lines indicated in the left panel showing filopodia penetrating the actomyosin cortex of the neighboring cell. The z-axis indicates the basal to apical direction. i Left panel: close-up view of follicle cells marked by MyoII-mCherry (red) and E-caderin-GFP (endo E-cad, green). Right panels: cross-sections along the two dashed lines indicated in the left panel showing filopodia penetrating the actomyosin cortex of a neighboring cell. The z-axis indicates the basal to apical direction. j Left panel: basal view of follicle cells, labeled with moeABD-mCherry and MyoII-GFP. Right panels: moeABD and MyoII shown separately. Scale bars are 10 μm in a, e, f, 5 μm in h left panel, i left panel, g and j, 2 μm in h right panels and i right panels. The results shown in a, e–j have been successfully repeated from the at least four independent experiments.

