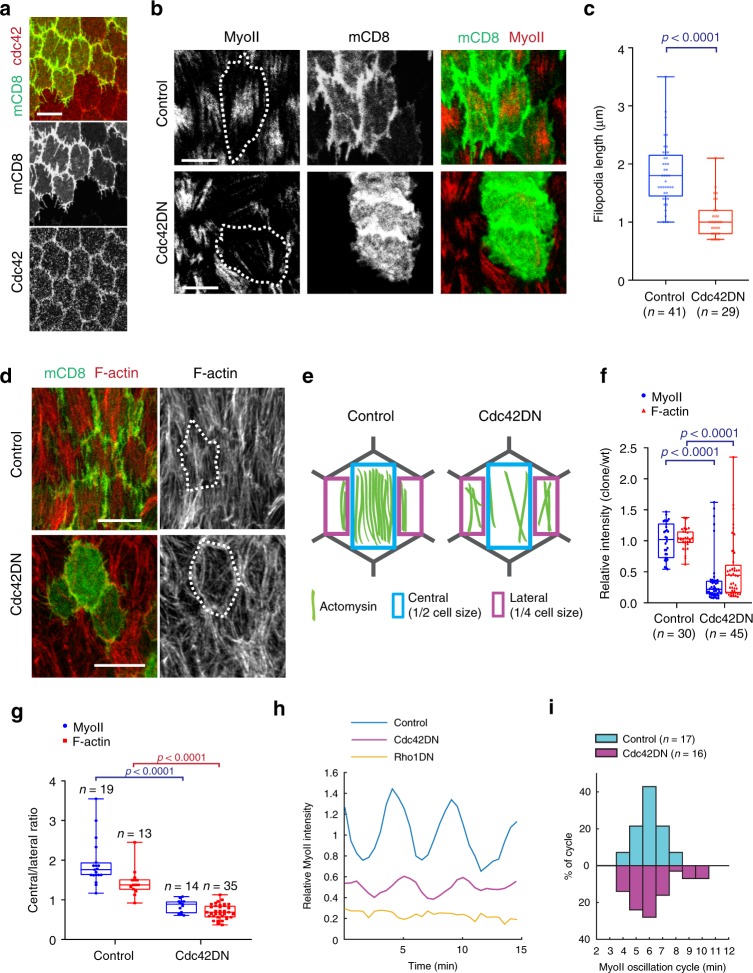
Fig. 2. Cdc42 activity controls intercellular filopodia and stress fiber formation at the basal domain of follicle cells.
a Basal view of follicle cells at stage 10A (S10A): Cdc42-mCherry (red) and stochastic clone expression of mCD8GFP (green). b Basal views of follicle cell clones not expressing (top panels) and expressing (bottom panels) the Cdc42DN transgene marked by mCD8GFP coexpression. MyoII is visualized using a MyoII-mCherry construct (Sqh::Sqh-mCherry). c Average filopodia length per cell for the n individual follicle cells not expressing (control, only mCD8GFP-expressing) and expressing Cdc42DN. For each analyzed individual cell, all filopodia not <0.5 µm were measured (3–11 filopodia per cell for control and 2–7 filopodia per cell for Cdc42DN). Nine egg chambers were analyzed for control and five for Cdc42DN. p < 0.0001 by two-sided Mann–Whitney test. d Basal view of follicle cell clones not expressing (control, only mCD8GFP expressing, top panels) and expressing (bottom panels) the Cdc42DN transgene, marked by mCD8GFP coexpression. F-actin is marked by phalloidin staining. The results shown in a, b, d have been successfully repeated from the at least four independent experiments. e Schematic representation of the actomyosin distribution at the basal side of follicle cells in control and Cdc42DN-expressing backgrounds. f Relative (clone/wild type) MyoII and F-actin intensities in the n individual control (only mCD8GFP expressing) and Cdc42DN cells. p < 0.0001 by two-sided Mann–Whitney test. g Relative (central/lateral) distribution of MyoII and F-actin intensity in the n individual control (only mCD8GFP expressing) and Cdc42DN cells. p < 0.0001 by two-sided Mann–Whitney test. In c, f, g boxes extend from the 25th to 75th percentiles, the mid line represents the median and the whiskers indicate the maximum and the minimum values. h MyoII-mCherry intensity over time for a representative cell in the control (only mCD8GFP expressing), Cdc42DN and Rho1DN backgrounds. The average MyoII intensity in the control background is set to 1. i Percentage of oscillating cycle time periods in the n individual control (only mCD8GFP expressing) and Cdc42DN-expressing cells. Scale bars are 10 µm in a, b, d.

