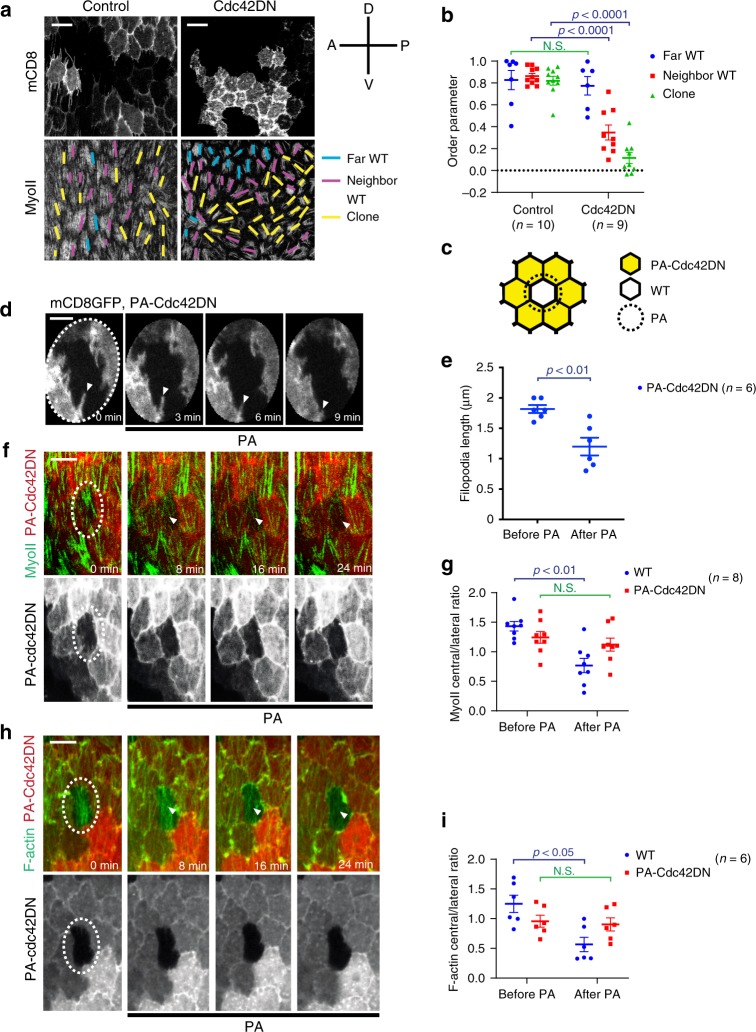
Fig. 5. Cdc42 has a non-cell autonomous role in stress fiber organization.
a Micrographs showing follicle cell clones not expressing (left panels) and expressing (right panels) the Cdc42DN transgene marked by mCD8GFP coexpression. MyoII is visualized by using a MyoII-mCherry construct. Yellow lines, purple lines and blue lines mark the orientation of the basal stress fibers in the clone cells, in the wild-type cells that neighbor clone cells and in the wild-type cells that are not neighboring the clone cells, respectively. A-P and D-V indicate the anterior-posterior and ventral-dorsal axes. b Order parameter for the three types of follicle cells indicated from the n egg chambers not expressing (control, only mCD8GFP expressing) and expressing the Cdc42DN transgene. For the far WT comparison: p = 0.5338; for the neighbor WT comparison: p < 0.0001; for the clone comparison: p < 0.0001; all by two-sided Mann–Whitney test. c Schematic diagram showing the region of photoactivation (PA, dashed circle) in experiments where one wild-type cell is surrounded by PA-Cdc42DN-expressing clones. Only the sub-basal cell–cell contact zones of PA-Cdc42DN clones facing the wild-type cells are photoactivated. d, f, h Time-lapse series showing the experiment represented in c for PA-Cdc42DN-expressing clonal cells labeled with mCD8GFP (d), MyoII-GFP (f), and UtrABD-GFP (h), respectively. Dashed ellipses indicate the photoactivated region. Arrow heads indicate filopodia in d and medial-basal regions in f, h. e Average filopodia length per cell (from four egg chambers) measured before and 10–15 min after photoactivation in the n individual cells of the experiments represented in c and d. p = 0.0065 by two-sided Mann–Whitney test. g, i Relative (central/lateral) distribution of MyoII (g) and F-actin (i) in the n individual wild-type and PA-Cdc42DN-expressing cells before and 20–30 min after photoactivation as shown in c. For relative distribution of MyoII signal, the WT before- vs. after- photoactivation comparison: p = 0.0011, the PA-Cdc42DN before- vs. after- photoactivation comparison: p = 0.3282; for relative distribution of F-actin signals, the WT before- vs. after- photoactivation comparison: p = 0.0108, the PA-Cdc42DN before- vs. after- photoactivation comparison: p = 0.6991; all by two-sided Mann–Whitney test. Data are presented as mean values +/− SEM. Scale bars are 10 μm in a, f, h and 5 μm in d.

