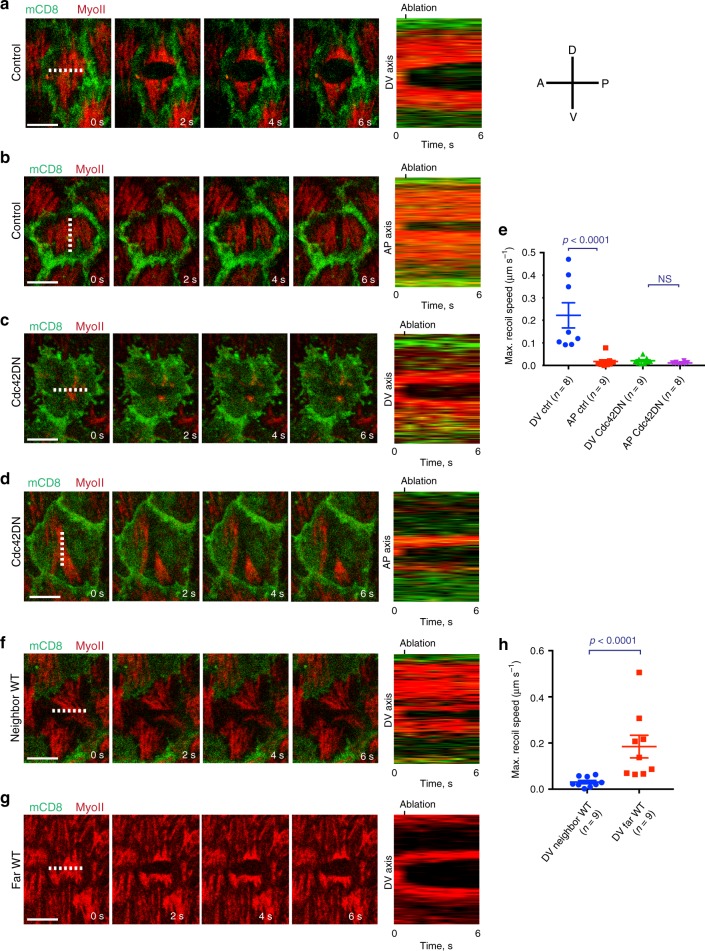
Fig. 6. Cortical tension anisotropy is under the control of Cdc42.
a–d Time-lapse series of a representative cell not expressing (a, b) and expressing (c, d) the Cdc42DN transgene marked by mCD8GFP coexpression, before (panel on the left) and after ablation (indicated by the dashed line) of the basal actomyosin network along the AP (a, c) and the DV (b, d) axes. MyoII is visualized by using a MyoII-mCherry construct. Right panel: kymographs illustrating network recoil along the DV (a, c) and the AP (b, d) axes after ablation. The results shown in a–d have been successfully repeated from the at least four independent experiments. e Maximum recoil speed after ablations in the n individual control (only mCD8GFP expressing) and Cdc42DN clones. For the control DV vs. AP comparison: p < 0.0001; for the Cdc42DN DV vs. AP comparison: p = 0.0788; both by two-sided Mann–Whitney test. f, g Time-lapse series of a representative wild-type cell, neighboring (f) or distantly located (g) from Cdc42DN-expressing clones, before and after ablation (indicated by the dashed line) of the actomyosin network along the AP axis. Right panel: kymographs illustrating network recoil after ablation. The results shown in f, g have been successfully repeated from the at least four independent experiments. h Maximum recoil speed after ablations in the n individual wild-type cells that are neighboring or distantly located from Cdc42DN-expressing clones. p < 0.0001 by two-sided Mann–Whitney test. Data are presented as mean values +/− SEM. Scale bars are 5 μm in a, b, c, d, f, g.

