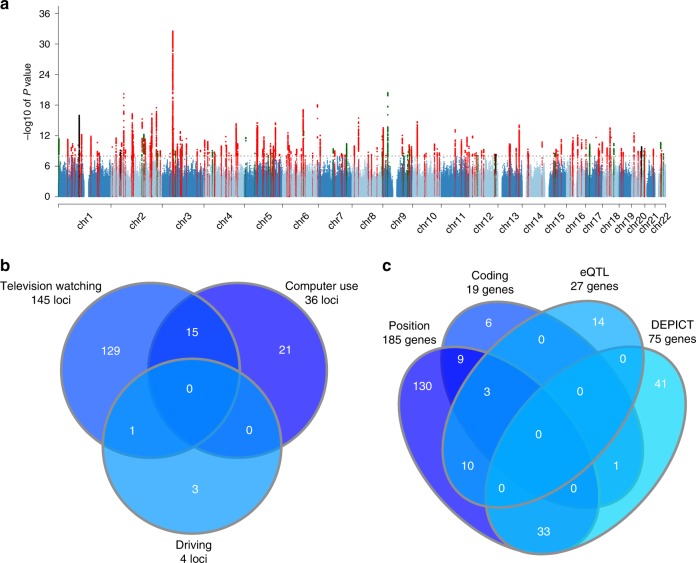
Fig. 2. Results of genome-wide and candidate gene analyses of sedentary behaviours.
a Overlay Manhattan plot shows the results for the genome-wide associations with sedentary behaviour traits among individuals of European origin. Loci reaching genome-wide significance (P < 1 × 10⁻⁸) are coloured red for television watching, green for computer use and black for driving. b Venn plot shows overlap between loci found for different sedentary behaviours. c Venn plot shows overlap of genes tagged by one or multiple strategies. EQTL expression quantitative trait loci, DEPICT data-driven expression prioritized integration for complex traits.

