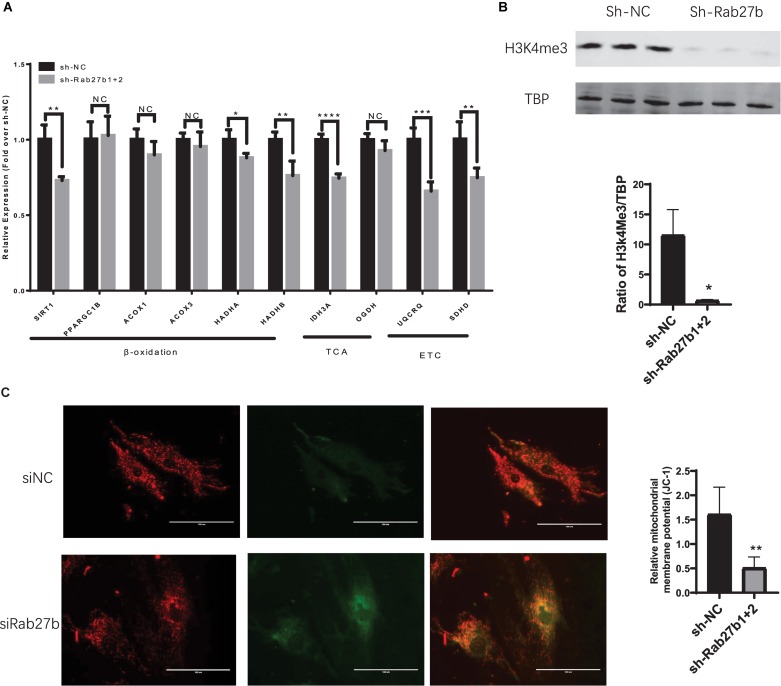
FIGURE 6.
(A) qRT-PCR analysis of genes related to mitochondrial fatty acid oxidation; TCA, tricarboxylic acid cycle; ETC, electron transport chain. The amount of mRNA was normalized using GAPDH. (n = 3–4). (B) Western blotting of H3k4me3 protein using TBP as a loading control (n = 3). (C) Mitochondrial membrane potential was measured by JC-1 staining and the images were obtained by fluorescent microscopy. Scale bars = 100 μm. The deltapsim is expressed as the ratio of red fluorescence to green fluorescence (n = 5–6). Results are shown as mean ± SD (NS, p > 0.05, *p < 0.05, **p < 0.01, ***p < 0.001, ****p < 0.0001).

