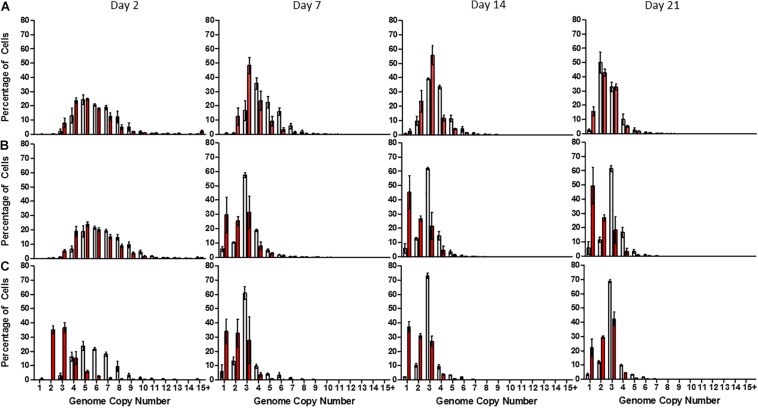
FIGURE 2.
Distribution of genome copy number in populations of Synechocystis GT-P (gray) and Synechocystis ΔdnaA (red) after 2, 7, 14, and 21 days growth in (A) high phosphate (B) low phosphate, and (C) no-phosphate BG-11. The average genome distribution of three biological replicates are shown with error bars. The x-axis portrays the genome copy number per cell and the y-axis the percentage of cells within a sample of 50,000 cells. Cells were grown under 40 μmol photons m–2 s–1 of white light, at 100 rpm and 31°C.

