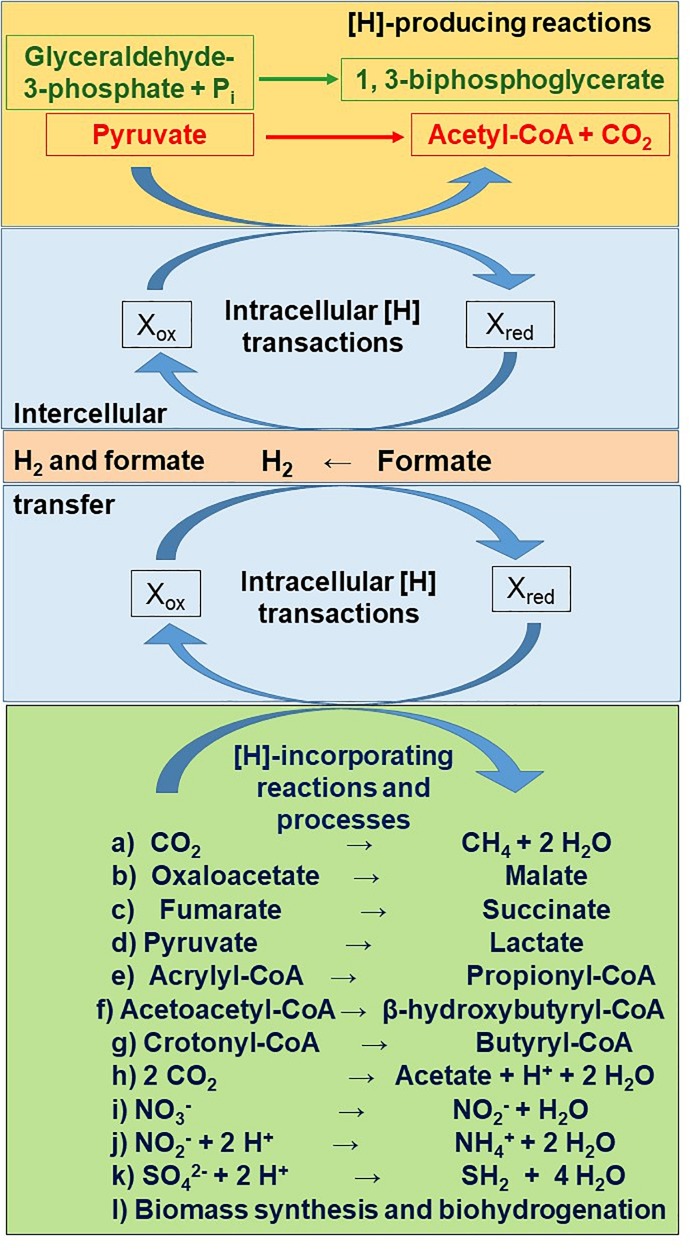
FIGURE 2.
Main reactions releasing (orange rectangle) and incorporating (green rectangle) metabolic hydrogen ([H]), as connected by intracellular (sky blue rectangle) and intercellular (salmon rectangle) metabolic hydrogen transactions. The stoichiometry of production and incorporation of reducing equivalents is not depicted.

