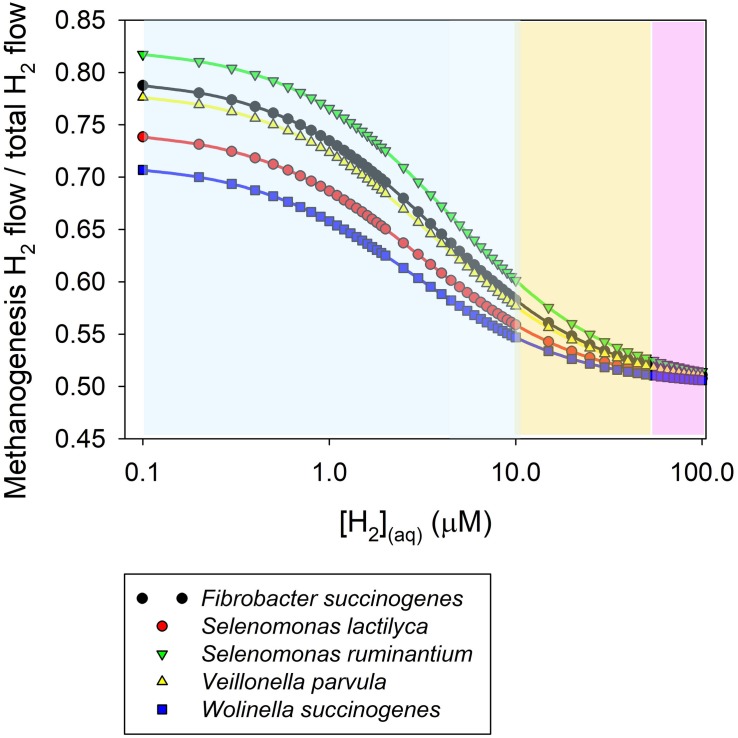
FIGURE 4.
Simulation of the proportion of dihydrogen taken up by methanogens in co-culture with various fumarate reducers as a function of dissolved H2 concentration. The simulation was conducted based on a kinetic Michaelis-Menten-wise competition for dihydrogen. Apparent Km for H2 uptake were reported by Asanuma et al. (1999). An equal Vmax for dihydrogen uptake is assumed. The range of dissolved H2 concentration is based on Table 1. The sky blue area corresponds approximately to baseline dissolved H2 concentrations (i.e., in between meals). The salmon area corresponds approximately to H2 concentration peaks occurring closely after feeding. The purple area corresponds approximately to the range of H2 concentration that could be observed when methanogenesis is inhibited.

