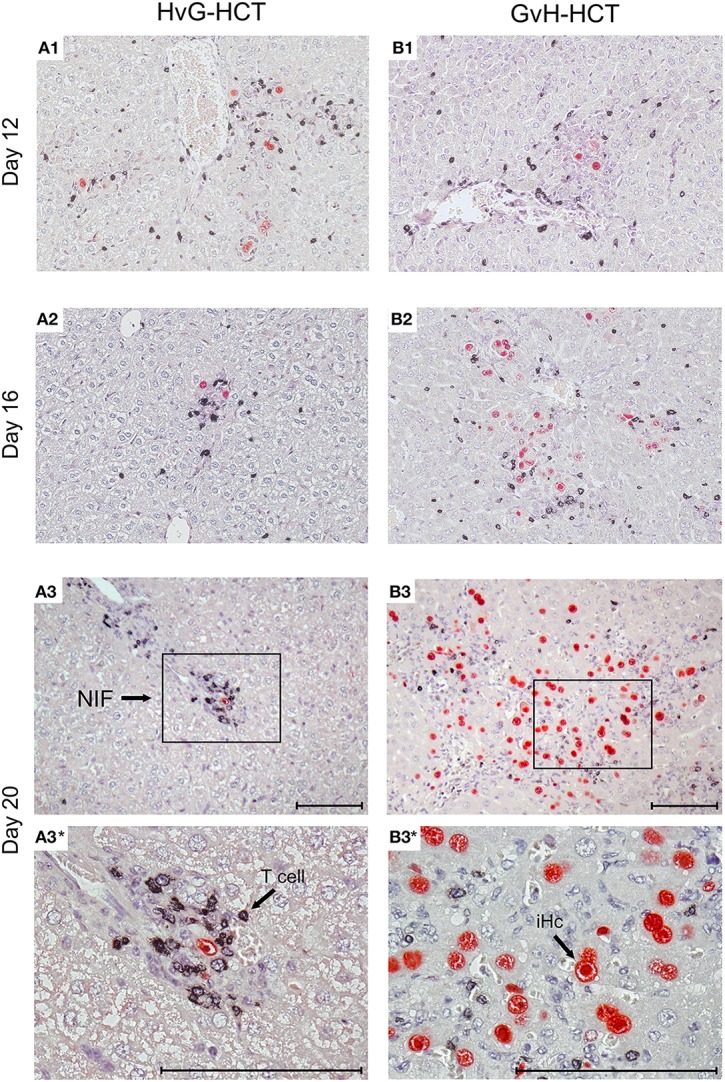
Figure 5.

Immunohistological images of liver tissue infection and infiltration by NIF-forming T cells after HvG-HCT compared to GvH-HCT. Representative 2C-IHC images of liver tissue sections are shown corresponding to the quantitative data shown in Figure 4 for the asterisk-marked observation times. (Red IHC staining) IE1 protein in nuclei of infected liver cells. (Black IHC staining) CD3ε protein expressed by T cells. (Left column) HvG-HCT. (Right column) GvH-HCT. (A1–A3 and B1–B3) low magnification overview images. Frames in day-20 images A3 and B3 demarcate regions resolved to greater detail by higher magnification in images A3* and B3*, respectively. NIF, nodular inflammatory focus. T cells in images A3 and A3* cluster around an infected cell to form a NIF that confines the infection after HvG-HCT. Note the disseminated infection and scattered T-cell infiltrates in images B3 and B3* for GvH-HCT. iHc, infected hepatocyte with a typical intranuclear inclusion body that indicates the late phase of the productive viral cycle. Bar markers: 100 μm.
