Figure 8.
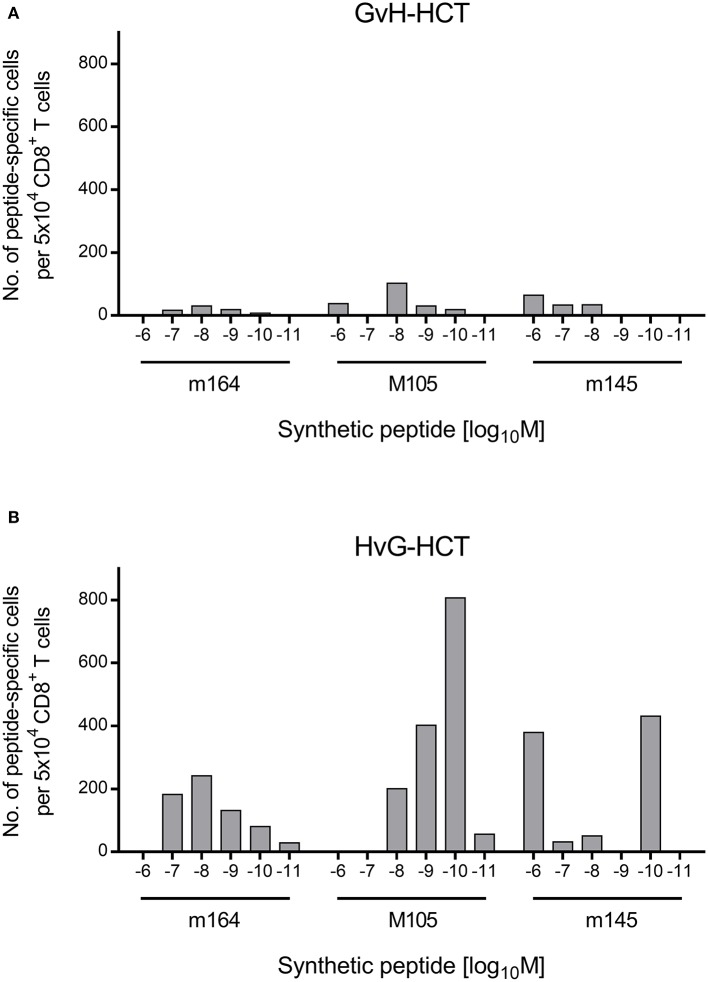
Gaussian-like avidity distributions of liver-infiltrating viral epitope-specific CD8+ T cells. (A) GvH-HCT. (B) HvG-HCT. Data of the experiment shown in Figure 7 are rearranged to reveal the non-cumulative avidity distributions that represent numbers of cells responding precisely to the indicated peptide-loading concentration (for the calculation method, see Holtappels et al., 2008).

