FIGURE 3.
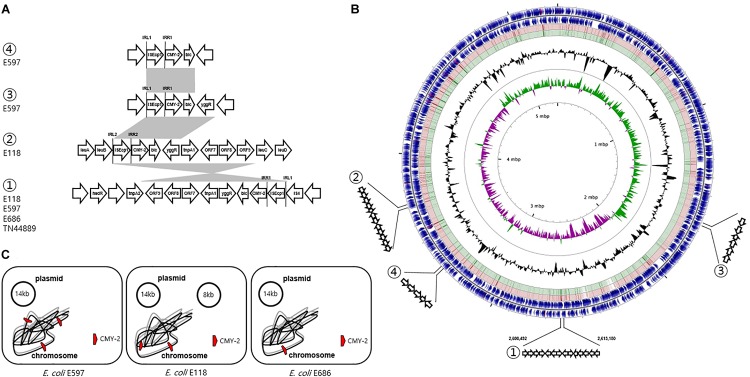
Genetic overview of three E. coli ST405 isolates carrying chromosomally located blaCMY–2. (A) Comparison of the genetic regions surrounding the blaCMY–2 gene. The shaded regions indicate the identical sequences sharing whatever same or converse orientation. (B) Circular genome map representation. The outermost ring: E118 open-reading frames on both forward and reverse strands. Red and green circle represents the blast results of E597 and E686 with E118 representing the positions covered by the BLASTN alignment, respectively. G + C content, black peak; G + C positive skew, green peak; G + C negative skew, purple peak. ① Region of genetic environmental structure from 2,600,492-2,613,180 bp in the E118, E597, and E686 strains identical to E. coli TN44889; ② region from 3,350,844-3,353,575 bp in E118 strain; ③ region from 1,669,367-1,672,220 bp in E597, and ④ region from 3,350,844-3,353,575 bp in E597 strain. (C) The chromosome and plasmid of three CMY-2-producing E. coli isolates.

