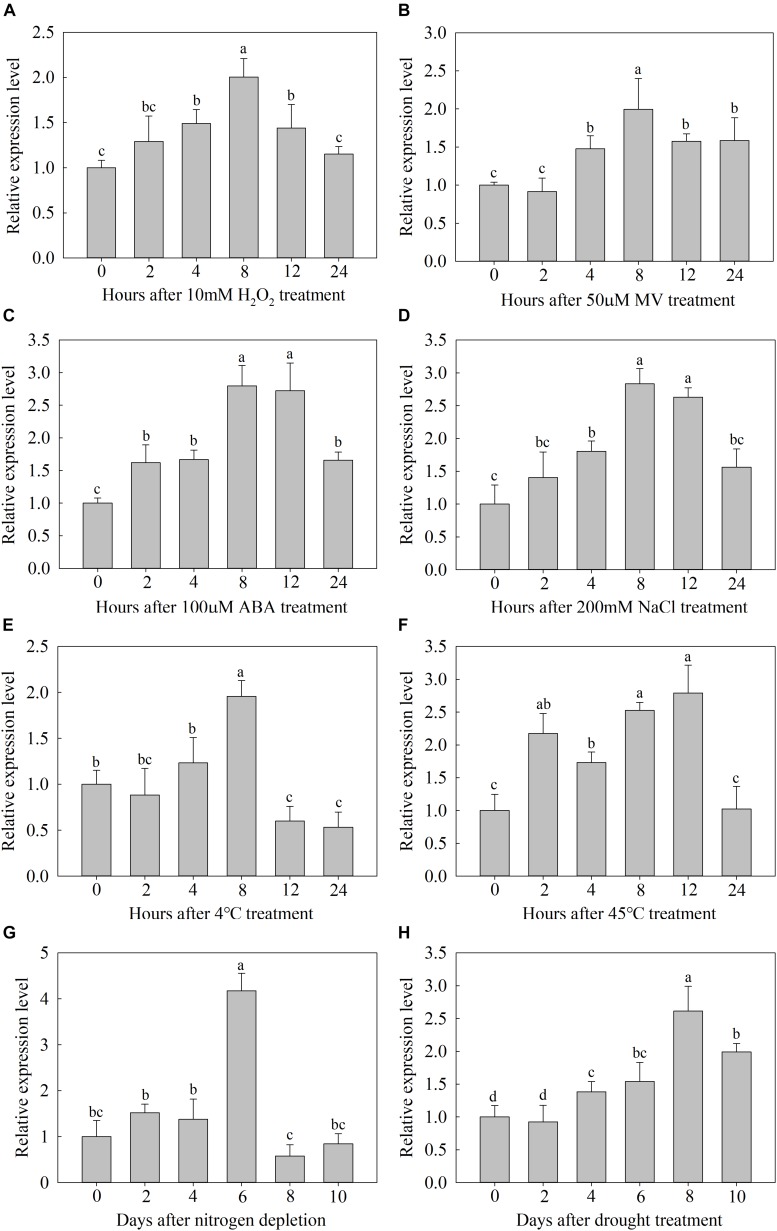
FIGURE 2.
Expression analysis of MdATG9. Relative expression (A) under H2O2 treatment, (B) MV treatment, (C) ABA treatment, (D) NaCl stress, (E) low temperature, (F) high temperature, (G) nitrogen depletion treatment, and (H) drought stress. Total RNA was extracted from leaf samples. Data are the means of three replicates with SEs. Different letters indicate significant differences between treatments, according to one-way ANOVA and Tukey’s multiple range test (P < 0.05).

