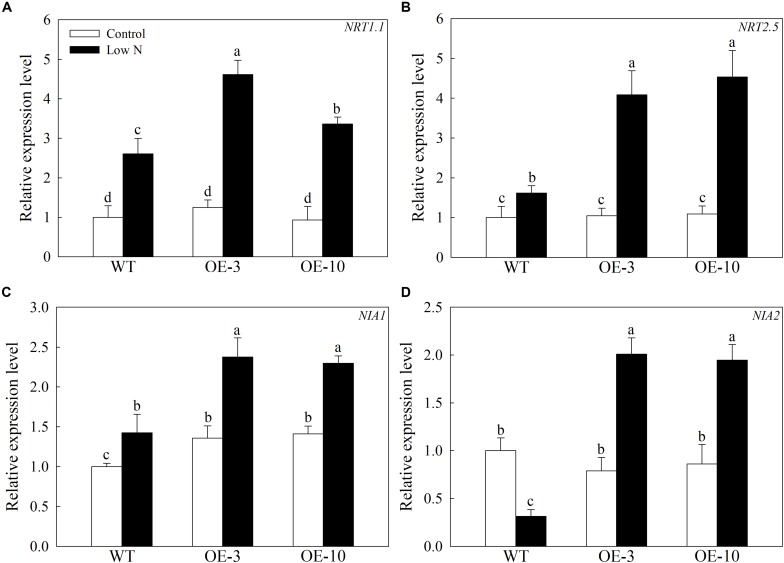
FIGURE 6.
Changes in transcript levels of four genes involved in nitrate uptake following nitrogen starvation. Changes in expression of (A) MdNRT1.1, (B) MdNRT2.5, (C) MdNIA1, and (D) MdNIA2 under nitrogen-starvation stress. Data are the means of three replicates with SEs. Different letters indicate significant differences between treatments, according to one-way ANOVA and Tukey’s multiple range test (P < 0.05).

