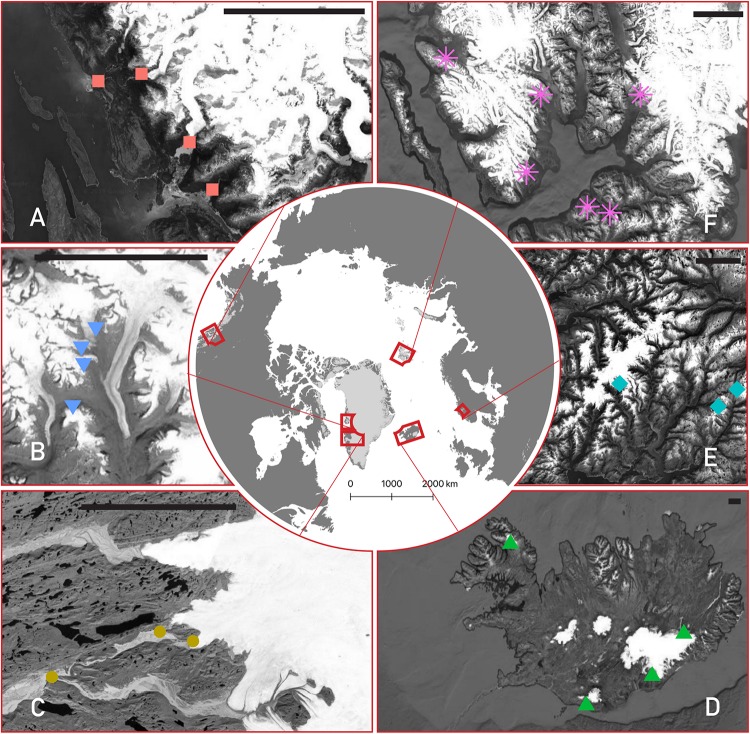
FIGURE 1.
Map of the six studied regions, with detailed insets for each showing the location of each glacier stream sampled. Counterclockwise from top-left: (A) southeast Alaska (red squares), (B) Qeqertarsuaq (Disko Island, blue upside-down triangles), (C) the Greenland Ice Sheet (gold circles), (D) Iceland (green triangles), (E) Norway (turquoise diamonds), and (F) Svalbard (purple asterisks). The scale bar in each panel represents 25 km. Background images are from Landsat/Copernicus and the United States Geological Survey, taken via Google and compiled with QGIS.

