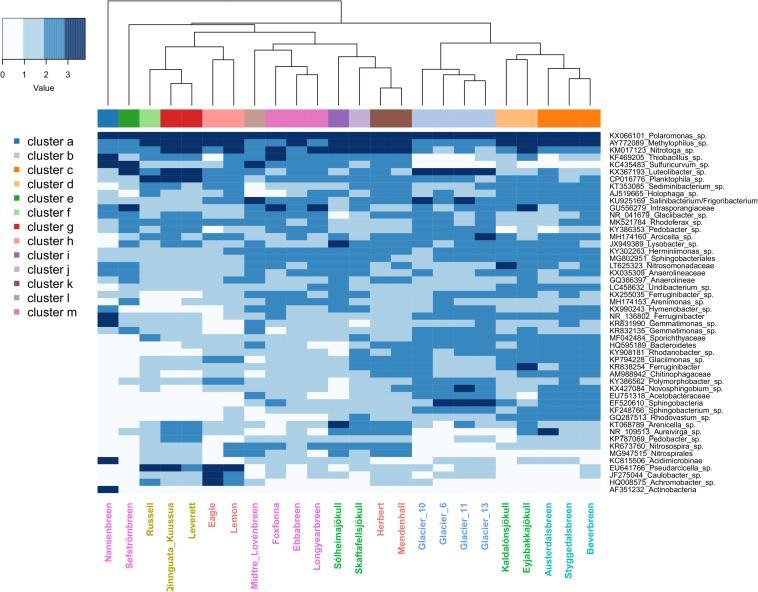
FIGURE 5.
Heatmap showing the log10 + 1-transformed abundance of the top 50 OTUs averaged by glacier stream site for the full rarefied dataset. Higher values are indicated by greater shade intensity. Site labels are colored by region, with Alaska sites indicated by red, the Greenland Ice Sheet (GrIS) by gold, Iceland by green, Norway by turquoise, Qeqertarsuaq by blue, and Svalbard by purple. The column side bar indicates the 13 significant site clusters.

