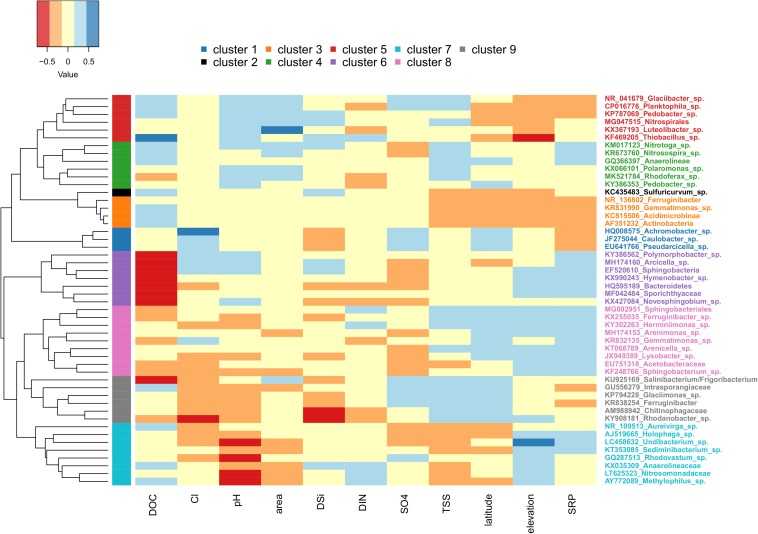
FIGURE 7.
Heatmap showing the relationship between environmental variables (only those with variance inflation factors less than or equal to 5 included) and the top 50 OTUs. Sites with missing metadata were excluded (i.e., Foxfonna and Midtre Lovénbreen, see Tables 1, 2). Cool colors indicate high Pearson correlation coefficient values, and warm colors indicate low values. The row side bar indicates the nine significant OTU clusters.

