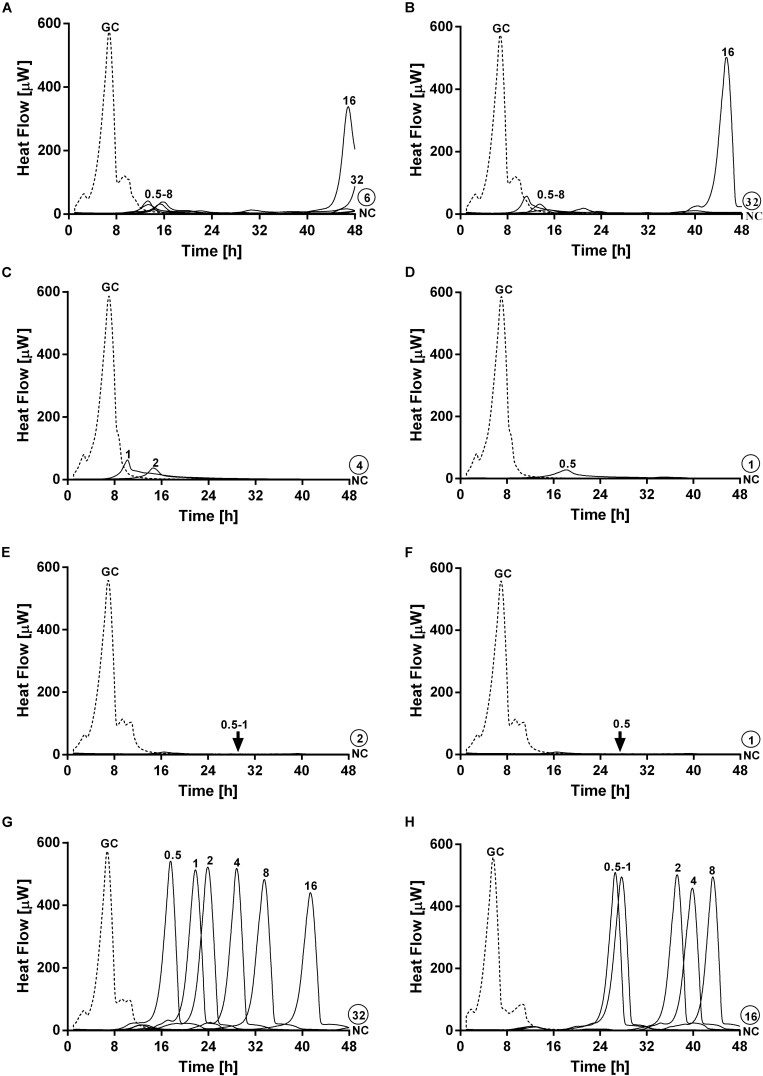
FIGURE 7.
Evaluation of MRSA ATCC 43300/P. aeruginosa ATCC 27853 dual-species biofilm viability after staggered exposure to phages and ciprofloxacin monitored by microcalorimetry. Each curve shows the heat produced by viable bacteria present in biofilms pretreated for 3 h (A,B), 6 h (C,D), 12 h (E,F) and 24 h (G,H) with PYO (graphs on the left) or PYO+Sb-1 (graphs on the right) followed by exposure to ciprofloxacin at increasing doses (0.5–64 mg/L) for 24 h. Numbers above curves represent antibiotic concentrations (in mg/L). Circled values represents the MBEC, defined as the lowest concentration of antibiotic that strongly reduced the viability of biofilm cells leading to the absence of heat flow production from treated beads when incubated during 48 h in fresh medium and no colonies after sonication and plating. GC, growth control (dashed line); NC, negative control.

