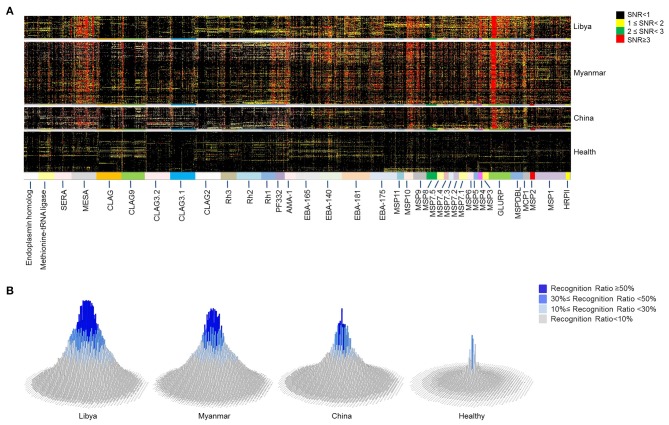
Figure 2.
Microarray profile analysis for immunogenic epitopes of Plasmodium falciparum antigens. Microarray screening was carried out with 2,024 peptides mapping to 37 proteins of P. falciparum 3D7 strain. Sera from naturally exposed individuals from Libya (n = 60), Myanmar (n = 171), and China (n = 58) and healthy individuals from China (n = 144) were used to detect the antibody recognition of the peptides. (A) The heat map depicts the breadth and intensity of antibodies reactivity across sera samples. Each dot shows a signal to noise (SNR) value of one individual. The color of the dot indicates the intensity of the reaction with SNR. (B) The histograms show the prevalence rate of 2,024 peptides in different regions derived from the microarray profile. The height and color of the column indicate the prevalence rate of each peptide. Each column represents one peptide.

