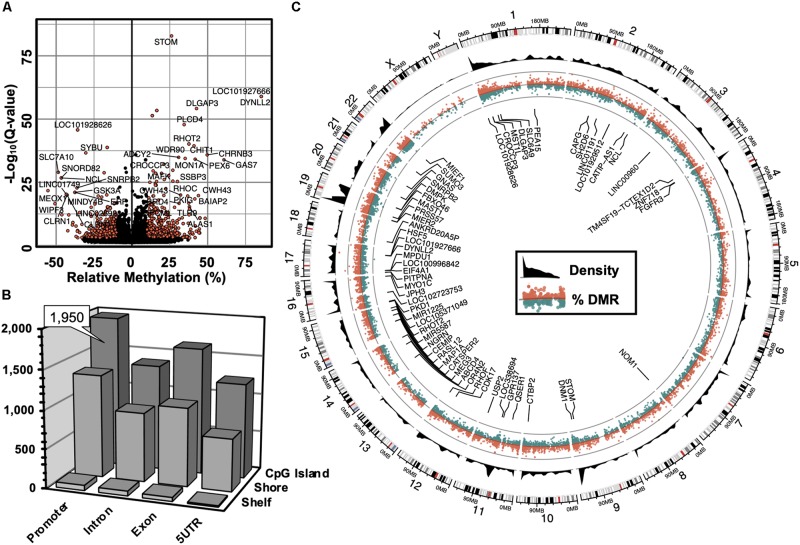
FIGURE 2.
Genome-wide alterations in DNA methylation. (A) Volcano plot illustrating -log10(Q-value) as a function of differentially methylated regions (DMRs, in % difference). Genes were labeled which contained robust changes in methylation (Q < 10– 15), | Methylation| > 25%). (B) 3-dimensional bar plot depicting the distribution of DMRs according to both genic annotation (promoter, intron, exon, and 5′ untranslated regions) and proximity to CpG Islands (CpG Island, Shore, and Shelf). (C) Circular plot illustrating the genomic distribution of DMRs (red = hyper-methylated, green = hypo-methylated), and DMR density (black). Labeled genes are DMRs (| Methylation| > 10%) that meet genome-wide significance (Q < 10– 8).

