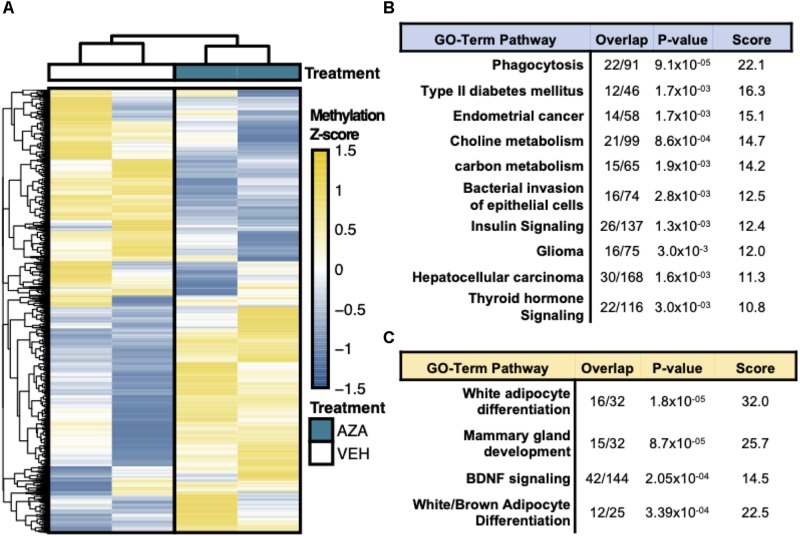
FIGURE 3.
Reduced Representation Bisulfite Sequencing Analysis. (A) Hierarchical clustering and heatmap analysis of regional differential CpG methylation (DMRs).* (B) GO-term enrichment analysis of hyper-methylated and (C) hypo-methylated DMRs demonstrating the % enrichment (“Overlap”), P-value of overlap by Fischer exact test, and composite enrichment score.

