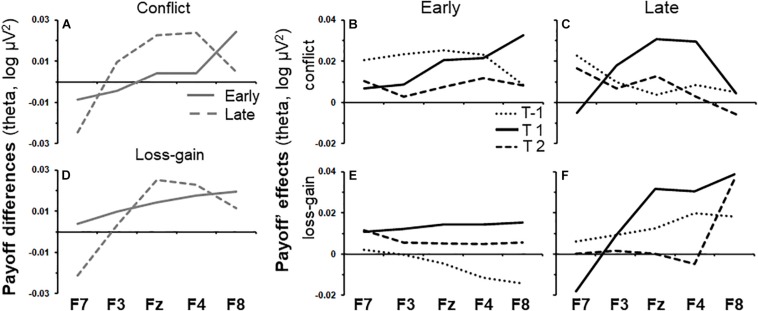
FIGURE 3.
Variations of payoff effects across recording sites (F7, F3, Fz, F4, and F8) and time periods for early and late task phases. (A) Conflict theta activity specific to the mid time point, calculated as the average of T-1 and T2 subtracted from T1. (B,C) show variations of conflict theta activity for each time period of interest, for the early and late task phases, respectively. T1 is the 0.5 s period from the onset of the trial-start stimulus. T-1 and T2 indicate the 0.5 s periods before and after T1, respectively. (D–F) as (A–C) but for the loss-gain activity difference rather than for conflict activity.

