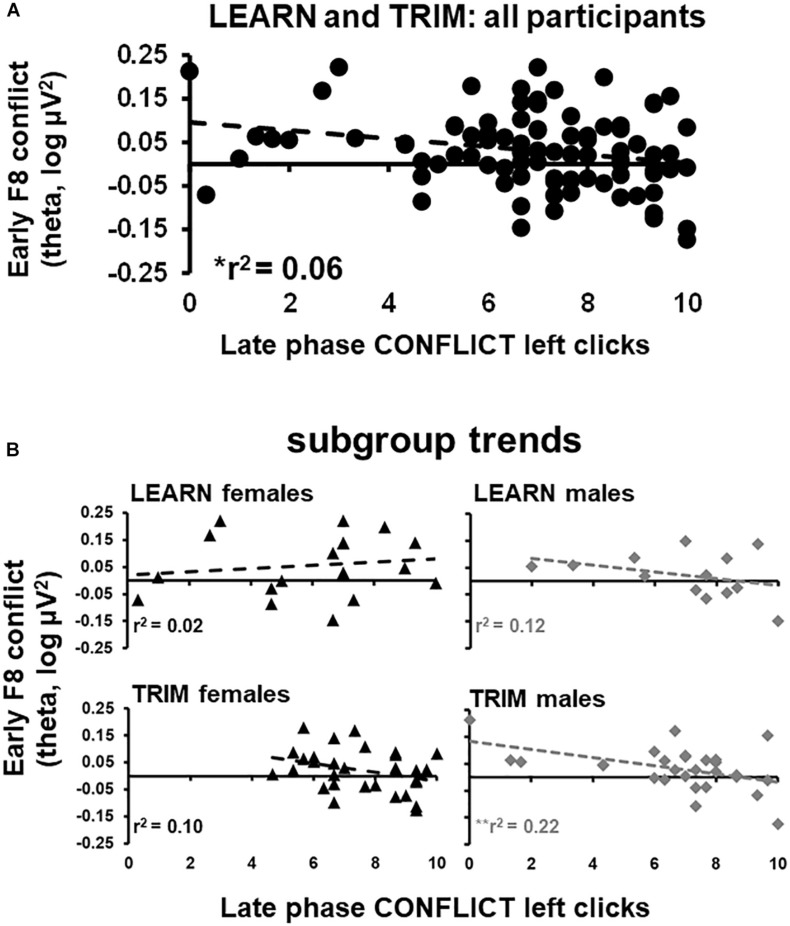
FIGURE 4.
Scatterplots of early phase conflict theta activity and late phase left clicks in CONFLICT. (A) scatterplot for all participants in both LEARN and TRIM. (B) Scatterplots for each subgroup: LEARN females, LEARN males, TRIM females and TRIM males. Trend lines are indicated by dotted lines. *p < 0.05; **p < 0.01.

