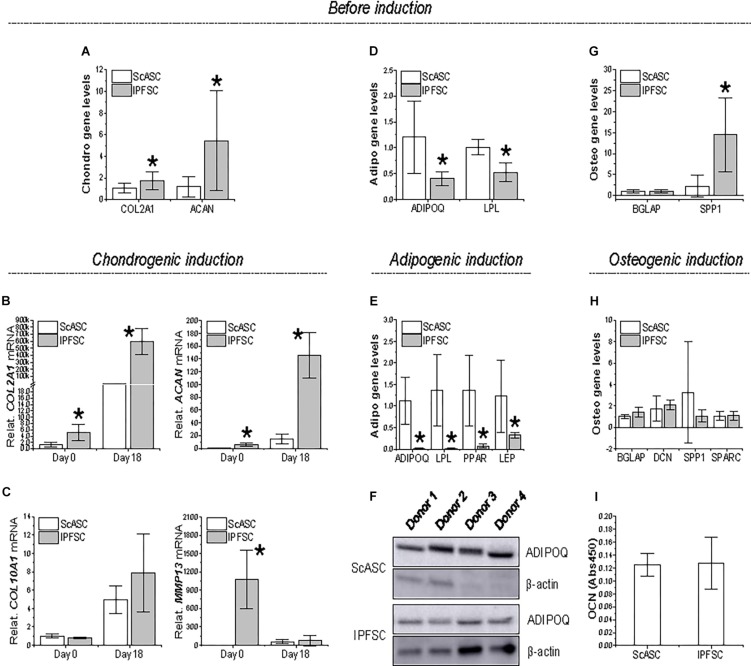
FIGURE 3.
Expression of differentiation genes in ScASCs (n = 4) and donor-matched IPFSCs (n = 4) before and after induction. For chondrogenic differentiation, typical markers, COL2A1 and ACAN, were evaluated using qPCR before (A) and after chondrogenic induction (B). Hypertrophic markers COL10A1 and MMP13 were also measured after chondrogenic induction (C). For adipogenic differentiation, typical markers, ADIPOQ and LPL, were evaluated using qPCR before (D) and after adipogenic induction (E). LEP expression was also measured after induction (E). Adiponectin (ADIPOQ) expression was confirmed using Western blot analysis with β-actin as an internal control (F). For osteogenic differentiation, typical markers, BGLAP and SPP1, were evaluated using qPCR before (G) and after osteogenic induction (H). Expression of DCN and SPARC were also measured after induction (H). Osteocalcin (OCN) expression was confirmed using ELISA analysis (I). Expression of each target gene in IPFSCs is plotted against the corresponding ScASCs, which is set as “1”, but for those in chondrogenic induction (B/C), expression in day 0 is plotted as “1”. Data are shown as bar charts. * indicates a significant difference compared to the corresponding control group (p < 0.05).

