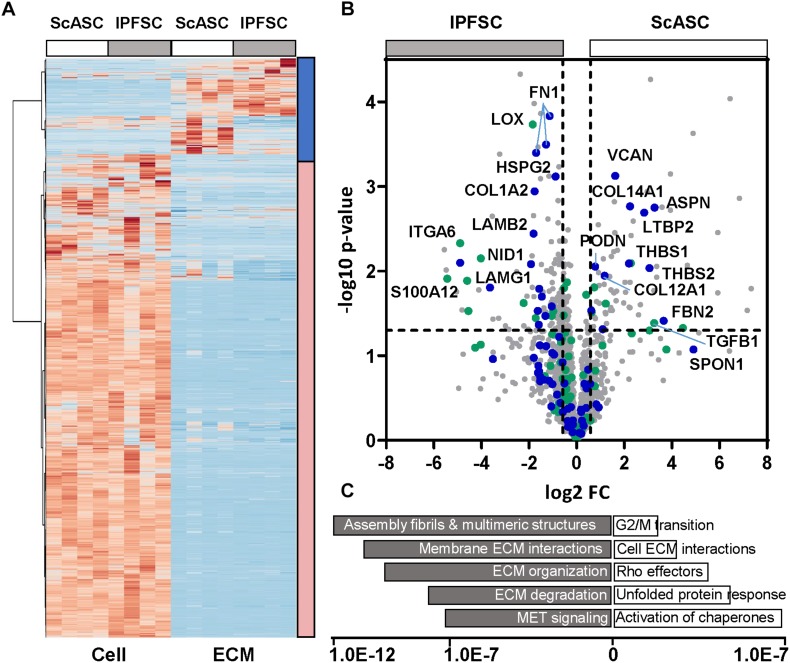
FIGURE 6.
Proteomic results of cells and ECMs from ScASCs versus IPFSCs of four donor-matched rabbits. (A) Heatmap for global representation of protein differences (Z score used). The blue bar on the left indicates the region highly enriched in ECM components, the red bar indicates the region that contains primarily intracellular proteins. (B) Volcano plot with the Y-axis indicating -log10 p-value and the X-axis of the fold change (FC) in log2. Core ECM proteins are indicated in blue and Matrisome associated proteins are in green. (C) Gene enrichment analysis (top pathways, Reactome) is shown with the X-axis indicating the statistical significance based on false discovery rates using the Benjamani_hochberg method.

