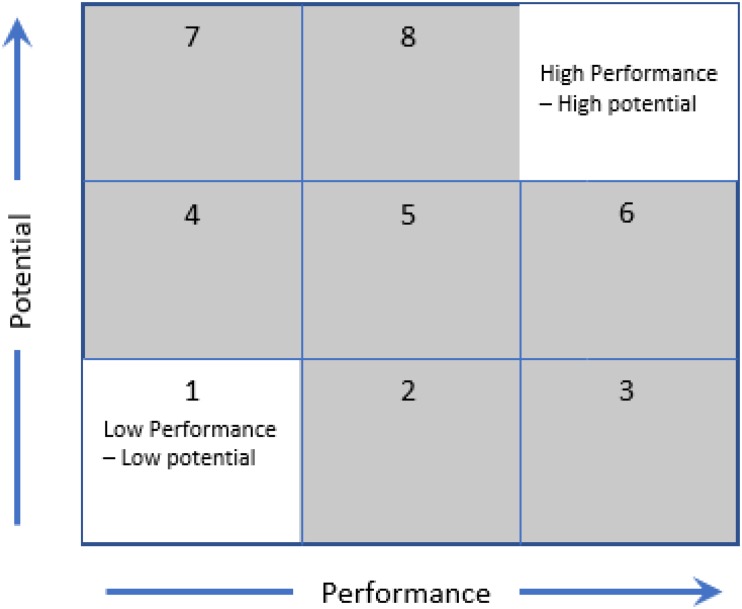
FIGURE 1.
Modified risk matrix from Baker et al. (2018a) highlighting the differing levels of risk when considering athletes for TIDS. Areas with no shading represent ‘low risk’ since performance-based selection systems will remove or keep low versus high performers due to how systems are typically structured (i.e., by confusing potential and current performance). The gray areas represent differing levels of risk that need to be considered relative to resources available in the system (e.g., what is the risk of eliminating a possible 7 through inaccurate selections?).

