FIGURE 1.
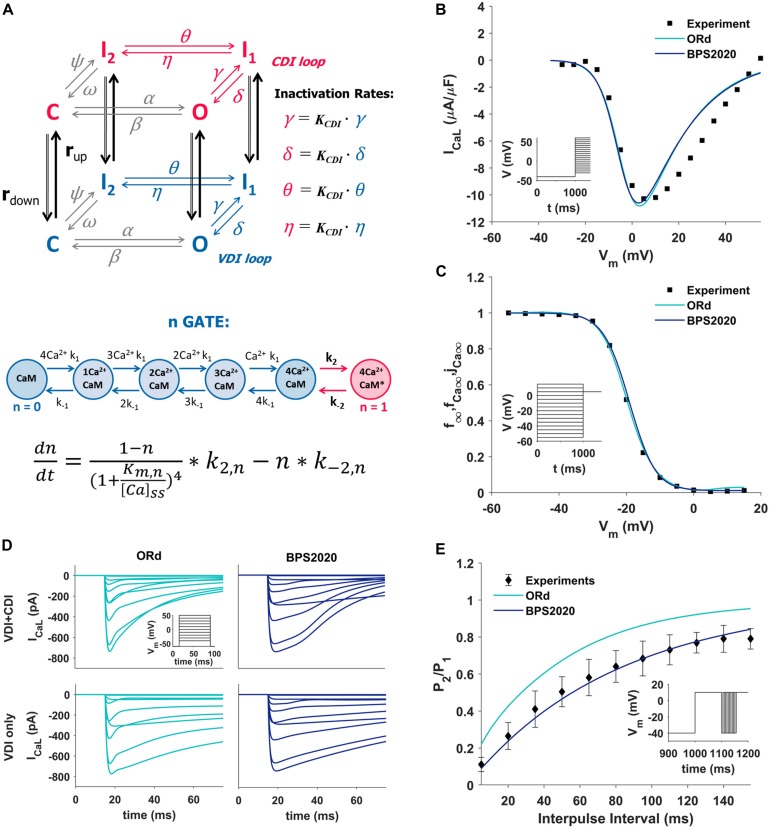
Summary of the design and validation of the new ICaL model. (A) Schematic representation of the Markov model structure: voltage-dependent inactivation (VDI) and Ca2+-dependent inactivation (CDI) are represented as two separate loops, with four states each (C, closed; O, open; I1 and I2, inactivated). Inactivation rates in the CDI loop are KCDI times faster than the corresponding rates in the VDI loop. VDI and CDI loops are interconnected by up/down rates (rup/rdown), dependent on the n-gate, which directly depends on intracellular Ca2+ and its binding to Calmodulin (CaM), as shown in the equation at the bottom of the panel, modified from Decker et al. (2009); O’Hara et al. (2011), and Passini and Severi (2013). (B,C) Comparison of the simulated ICaL I–V curve (B) and steady state inactivation curve (C) between ORd (light blue), BPS2020 (dark blue), and the experimental data from Magyar et al. (2000) (black squares). (D) Evaluation of the effect of CDI inactivation, by comparing VDI-only and VDI+CDI voltage clamp protocols for ICaL: both ORd (light blue, left) and BPS2020 (dark blue, right) show a faster inactivation when CDI is included, in agreement with experimental recordings with and without Ba2+ from O’Hara et al. (2011) (not shown). (E) Comparison of the recovery from inactivation between ORd (light blue), BPS2020 (dark blue), and the experimental data from Fülöp et al. (2004) (black diamonds), obtained using the P1/P2 protocol.

