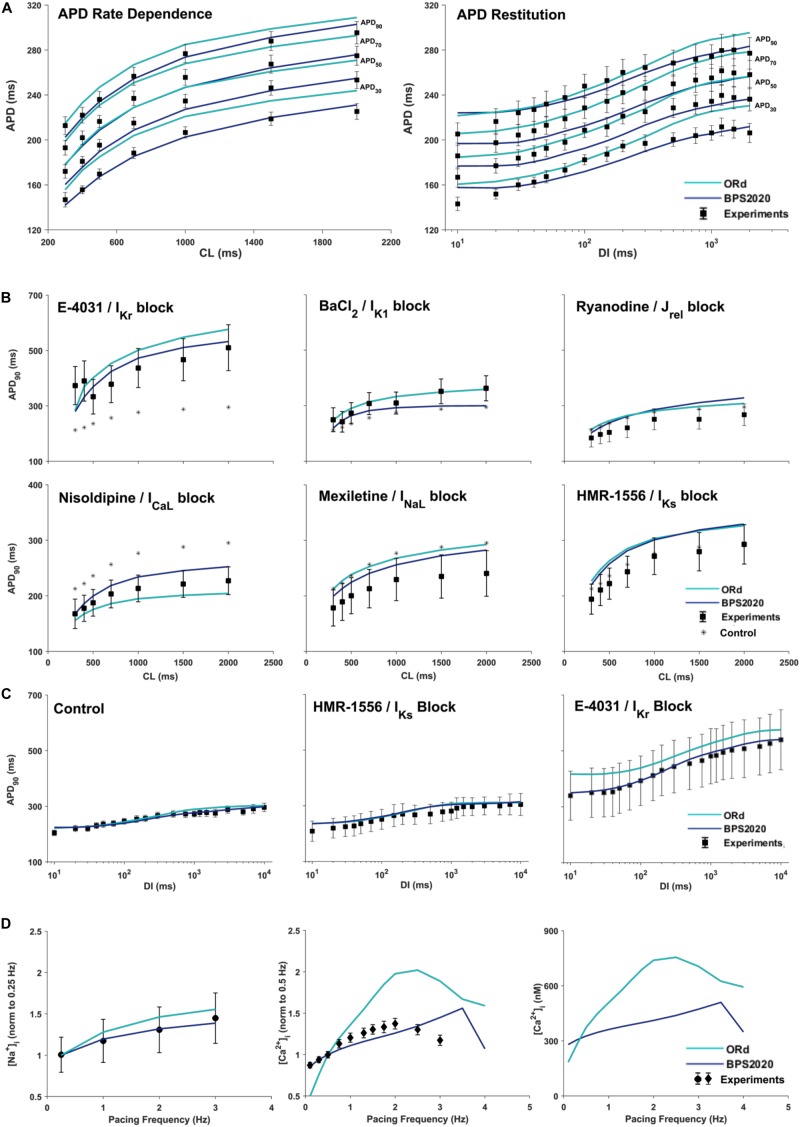
FIGURE 3.
Rate dependence properties of BPS2020 vs. ORd. In all panels, simulation results for BPS2020 and ORd are shown in dark blue and light blue, respectively. Experimental data from O’Hara et al. (2011); Pieske et al. (2002) and Schmidt et al. (1998) are shown as black squares, black circles and black diamonds, respectively. (A) Steady state action potential duration (APD) rate dependence (CL – cycle length) and APD restitution obtained with the S1S2 protocol (DI – diastolic interval). APDs computed at 30, 50, 70, and 90% of repolarization are labeled on the right. (B) Steady state APD90 rate dependence changes induced by specific current blocks; stars are the APD90 values in control conditions. (C) APD90 restitution changes induced by specific current blocks. (D) [Na+]i (left) and peak [Ca2+]i (middle and right) vs. pacing frequency.

