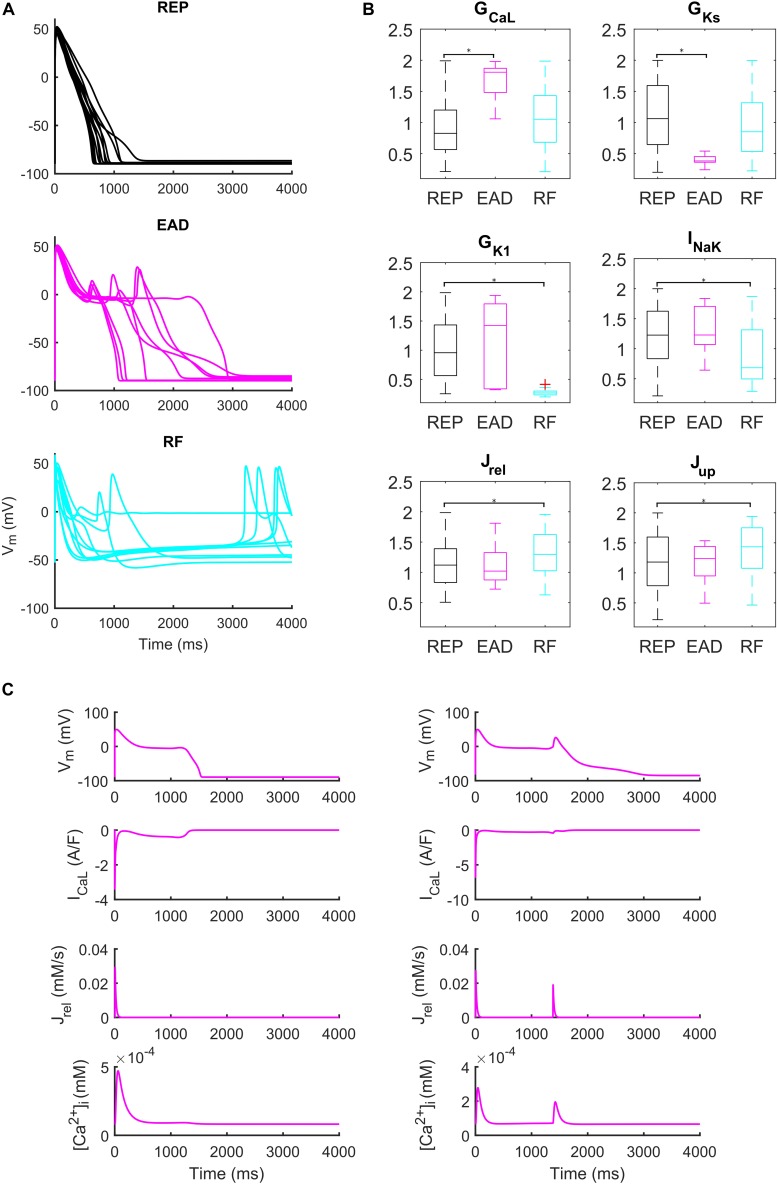
FIGURE 6.
Repolarization abnormalities – EADs. (A) Examples of different responses to dofetilide (0.1 μM), CL = 4,000 ms (Guo et al., 2011). Top: repolarizing models (black, REP); middle: models developing early afterdepolarizations (magenta, EAD) and bottom panel failing to repolarize (cyan, RF). (B) Distribution of the scaling factors which show statistically significant differences between the three categories: models repolarizing (REP, black), models developing EADs (EAD, magenta) and models failing to repolarize (RF, cyan) (*p < 0.05). Red crosses represent outliers. (C) EAD induced by ICaL reactivation (left) and EAD induced by Ca2+ release from SR (right).

