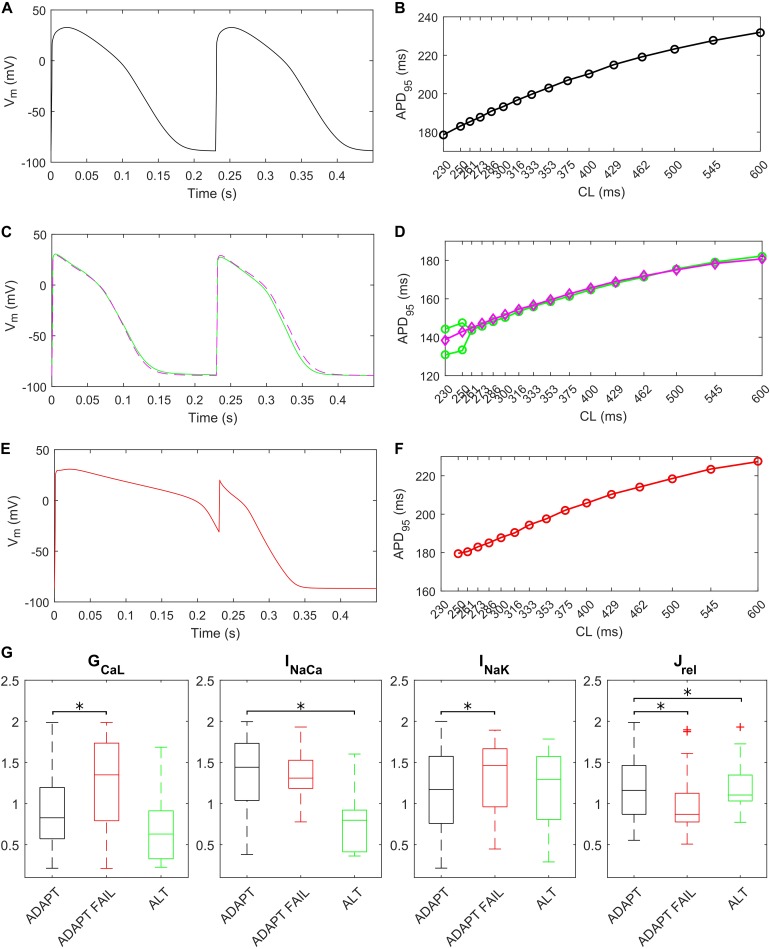
FIGURE 8.
Repolarization abnormalities – alternans. Action potentials (APs) at different cycle lengths (CLs) (pacing at 30 s if CL ≥ 300 ms, otherwise 15 s) and APD90-CL relationship for three models from the in silico population. The model (black) in (A,B) belongs to the ADAPT class. The model (green) in (C,D) from the ALT class showed alternans and produced a bifurcation. (E,F) Show an ADAPT FAIL model (red, whose AP fails to adapt for CL shorter than 250 ms). The magenta trace in (C,D) show the alternans suppression due to 30% Jup upregulation. (G) Distribution of the scaling factors showing statistically significant differences (∗p < 0.05) between the three categories: models adapting to changes in pacing rate (ADAPT, black), models failing to adapt (ADAPT FAIL, red) and models developing alternans (ALT, green). Red crosses represent outliers.

