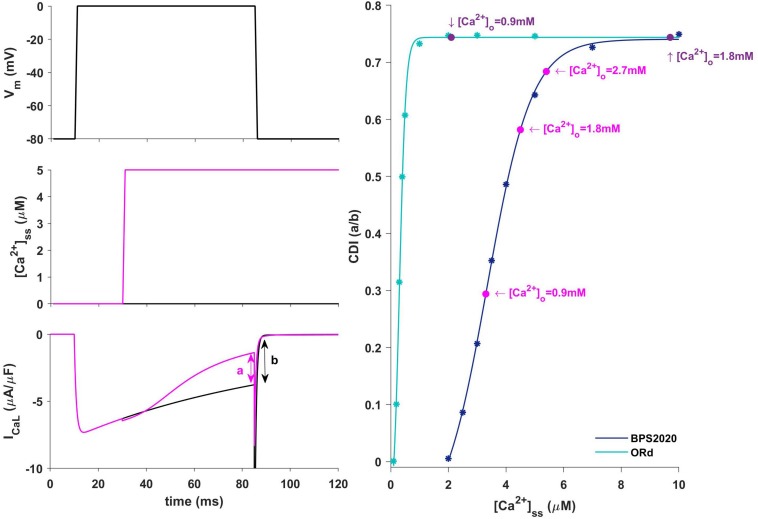
FIGURE 9.
Ca2+-dependence inactivation. Left: framework for isolating the Ca2+-dependent inactivation (CDI) (from Limpitikul et al., 2018). Top: voltage step. Middle: [Ca2+]ss example of concentration step. Bottom: ICaL current in response to voltage activation at baseline [Ca2+]ss (black) and in response to a [Ca2+]ss step (magenta). Right: Steady state CDI (evaluated as a/b) as a function of [Ca2+]ss with ORd (light blue) and BPS2020 model (dark blue), fitted with a Boltzmann curve; CDI quantification are also highlighted for different [Ca2+]o values (magenta for BPS2020 and purple for ORd).

