
Figure 4.
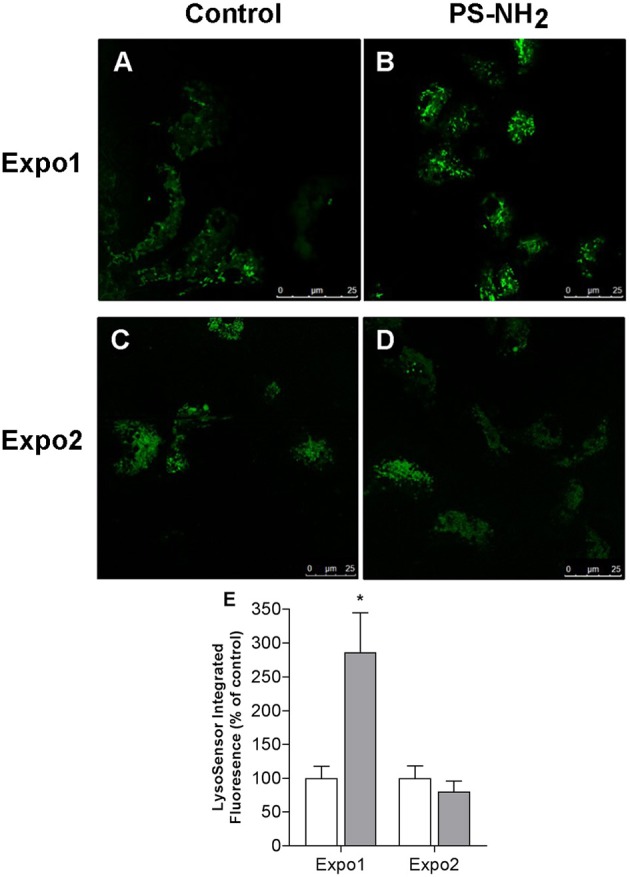
Confocal fluorescence microscopy: effects of exposure of Mytilus galloprovincialis to PS-NH2 on hemocyte lysosomal compartment evaluated by LysoSensor™ fluorescence and representative images (443 nm excitation/505 nm emission) are reported. Upper panel: hemocytes after Expo1, control (A) and PS-NH2 exposed (B); lower panel: hemocytes after Expo2, control (C) and PS-NH2 exposed (D). (E) Quantification of the LysoSensor fluorescence signal in hemocytes from control and PS-NH2-exposed mussels after each exposure. Data, expressed as percentage of integrated fluorescence density/cell area with respect to each control group, are the mean ± SD of four experiments. *P ≤ 0.05 (ANOVA followed by Tukey's test). Scale bars: 25 μm.