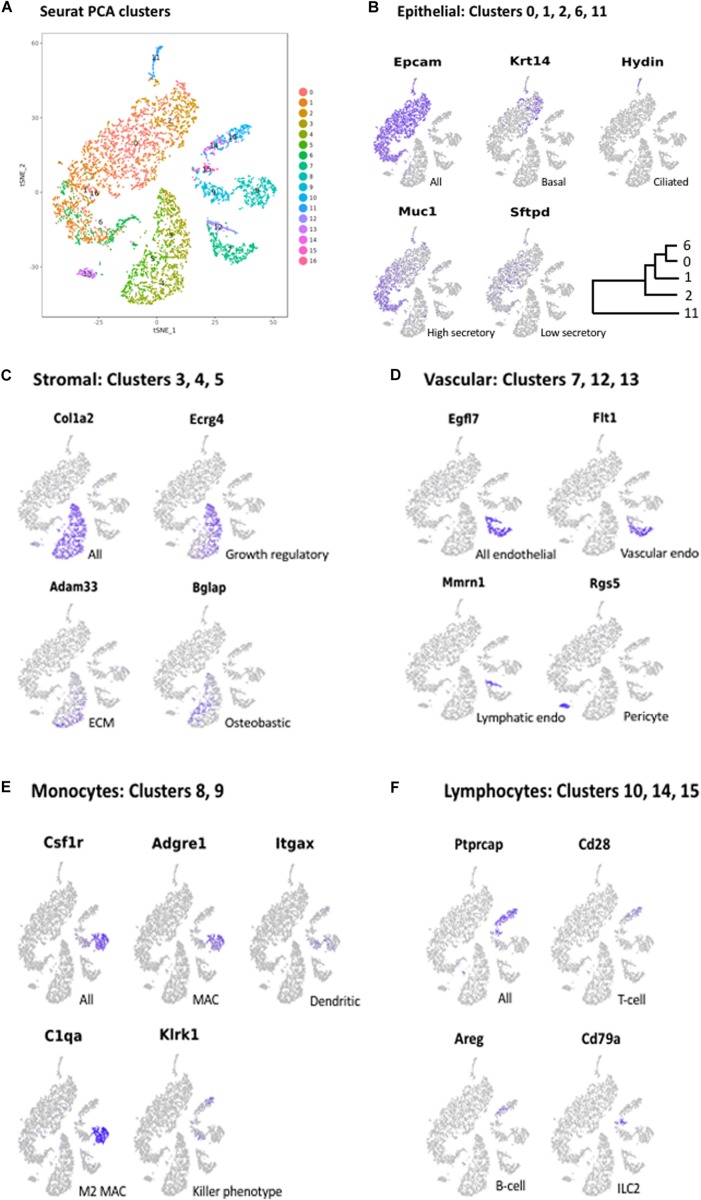
FIGURE 2.
(A) PCA clusters generated from the cells of all three mucosal samples, generated with Seurat. Seventeen clusters (0–16) were identified. Marker genes were again used to determine the cells types present in each cluster. Some cell types that were grouped in contiguous clusters by Cellranger were separated in the Seurat analysis. Marker gene expression in: (B) Epithelial cell clusters (0, 1, 2, 6, 11); (C) Stromal cell clusters (3, 4, 5); (D) Vascular cell clusters (7, 12, 13); (E) Monocyte clusters (8, 9); and (F) Lymphocyte clusters (10, 14, 15).

