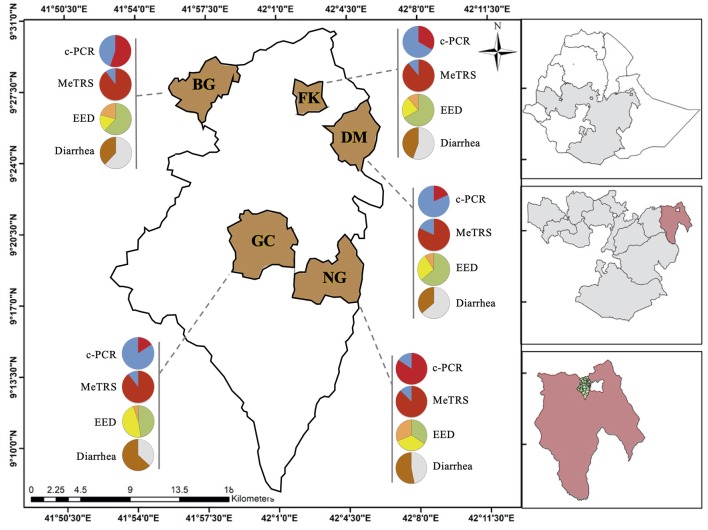
Figure 1.
Prevalence of Campylobacter, environmental enteric dysfunction (EED) and diarrhea in children in the five kebeles from Haramaya District (East Ethiopia). Pie graphs in red (positive for Campylobacter) and blue (negative for Campylobacter) represent the Campylobacter prevalence in stool samples (n = 100) collected from the designated kebele. Prevalence was determined using conventional PCR (c-PCR) or MeTRS (meta-total RNA sequencing). Pie graphs in green (“normal”), yellow (“moderate” EED), and orange (“severe” EED) represent the prevalence and severity of the EED for the designated kebele. Additional details concerning the EED severity determination are presented in Table S1. Pie graphs in brown (child currently having or had diarrhea in the past 15 days), gray (child had no diarrhea in the past 15 days) represent the diarrheal status of the children. GC, Gobe Chala; NG, Negaya; FK, Finkle; DM, Damota; BG: Biftu Geda.

