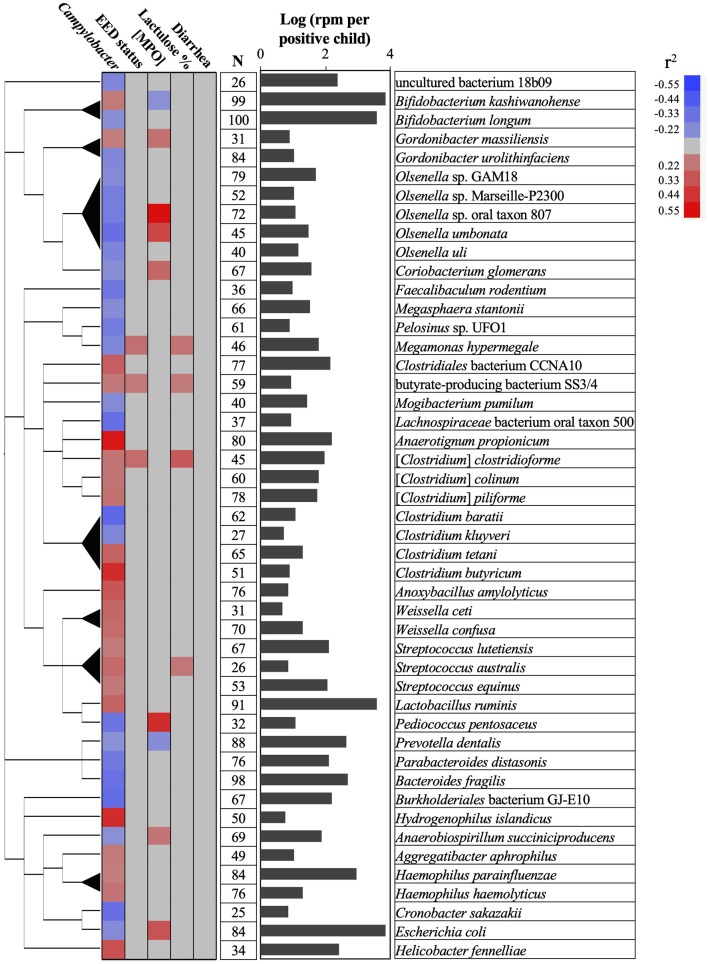
Figure 4.
Associations between Campylobacter, gut permeability, gut inflammation, environmental enteric dysfunction (EED), diarrhea, and child stool microbiome. A total of 47 bacterial species positively or negatively correlated (red or blue cells, respectively) with Campylobacter prevalence and abundance (reads per million, rpm; r2 > 0.20 or r2 < −0.20; P < 0.05), gut permeability (lactulose %), [MPO] in ng/ml, EED status (“normal,” “moderate” EED, “severe” EED), and/or the diarrhea prevalence data. Additional details concerning the EED severity determination are presented in Table S1. The phylogenetic tree was built using NCBI website (https://www.ncbi.nlm.nih.gov/Taxonomy/CommonTree/wwwcmt.cgi). N: number of stools positive for the designated bacterial species. The bar graph represents the average abundance (log rpm per positive stool sample) for the selected bacterial species. rpm, read per million; MPO, myeloperoxidase.

