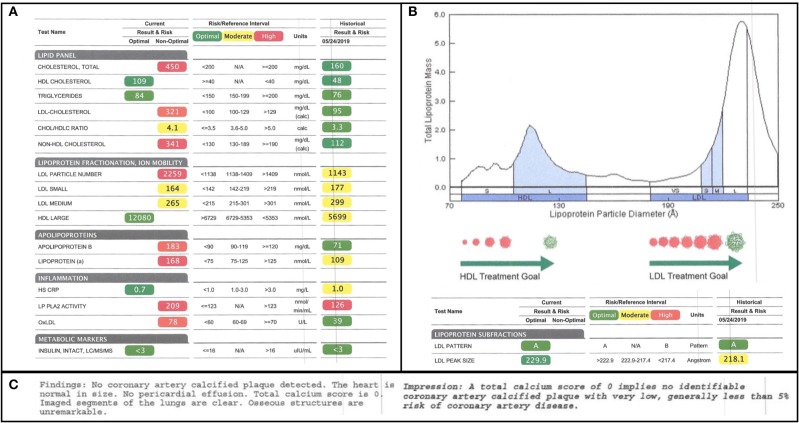
Figure 1.
Lipid Subfractionation. (A) The subject's baseline lipids, prior to starting his ketogenic diet, are shown on the right. His 7-month follow-up lipids are shown on the left. Green, yellow, and red imply optimal, medium, and high cardiovascular risk, respectively, based on standard reference ranges of isolated variables. (B) The subject's lipoprotein size distribution is characterized by a multimodal distribution of HDL, with the greatest peak being in large HDL, and a strong bias in LDL away from atherogenic, small LDL and toward large LDL. (C) Results of the subject's coronary artery calcium scan, performed at the time of the 7-month follow-up, indicating little-to-no calcified plaque accumulation.

