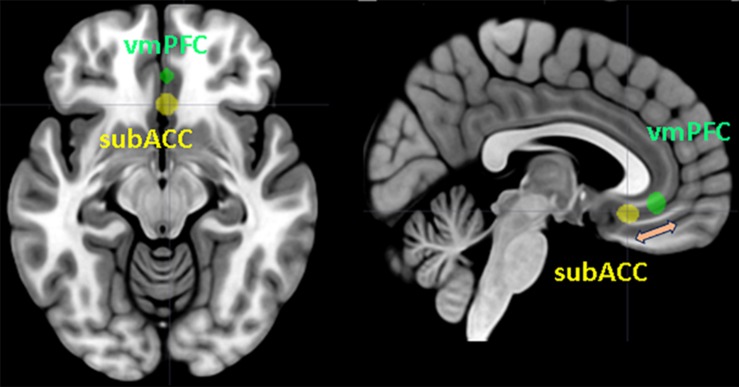
FIGURE 1.
Ventromedial prefrontal cortex (VMPFC) and subgenual region of the anterior cingulate cortex (subACC) superimposed on a standard T1 template. The figure represents the modulation between the two brain areas in the process of emotion regulation. Spheres with a 5 mm radius centered on the Montreal Neurological Institute (MNI) coordinates reported by Morese et al. (2019a) were generated using the MarsBaR toolbox (Brett et al., 2002). The MRIcron software package (Rorden et al., 2007) was applied for sphere display.

