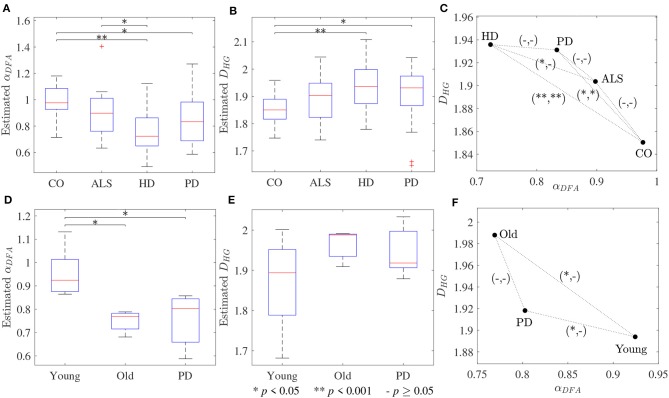
Figure 4.
Box plots of (A,D) scaling exponents αDFA and (B,E) fractal dimensions DHG; and (C,F) scatter plots between scaling exponents αDFA and fractal dimensions DHG for the first dataset (upper panels) and the second dataset (lower panels). The notation (−/*/**, −/*/**) denotes statistically significant difference at *p < 0.05, **p < 0.001, or no (−) in the (αDFA, DHG)-plane.

