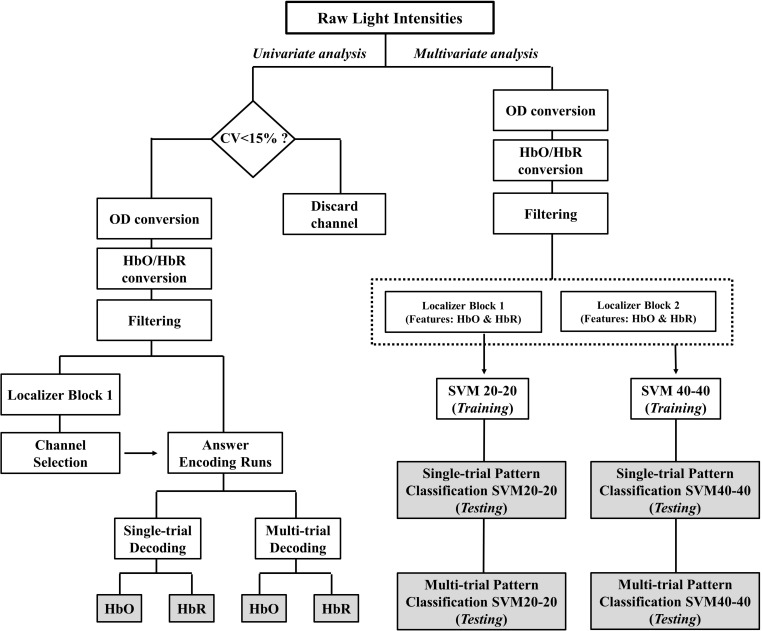
FIGURE 3.
Schematic depiction of the fNIRS signal analyses. The two main pipelines were univariate analysis and multivariate analysis. Each pipeline resulted in four accuracy outcomes. These outcome variables are represented in gray colored boxes. CV, coefficient of variance; OD, optical density; HbO, oxygenated hemoglobin; HbR, deoxygenated hemoglobin; SVM20-20, support vector machine with 20 training trials of each task; SVM40-40, support vector machine with 40 training trials of each task.

