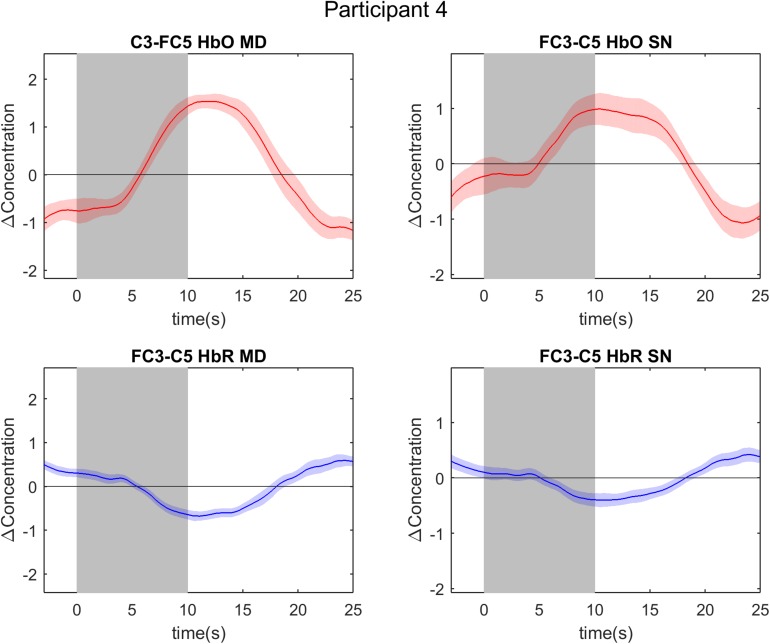
FIGURE 4.
Event-related averages of channels of interest in participant 4. The two graphs on the left are event-related averages from the first localizer run (mental drawing; MD). The two graphs on the right are event-related averages from the second localizer run (spatial navigation; SN). The top two graphs depict the oxygenated hemoglobin (HbO) response, whereas the bottom two graphs depict the deoxygenated hemoglobin (HbR) response. Each graph is the event-related average of 20 individual trials, with the darker average signal line and its standard deviation (lighter colored band surrounding the average signal line). Notice the clear and typical hemodynamic response during both tasks: a positive deflection in HbO and a negative deflection in HbR. The gray band from 0 to 10 s signifies the mental imagery time interval.

