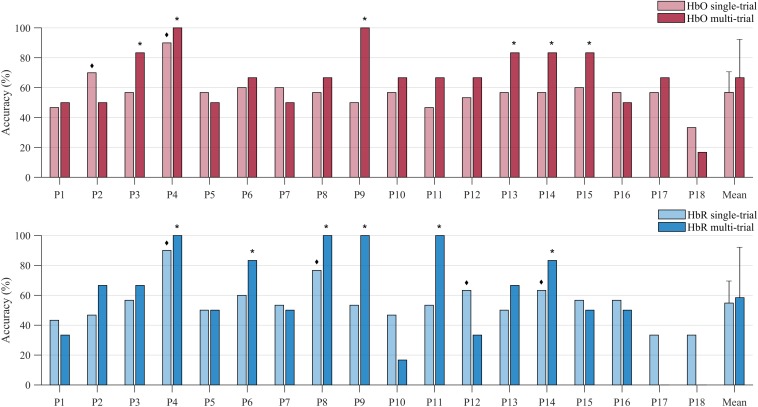
FIGURE 6.
Decoding accuracies of individual participants and the sample mean obtained with the single-trial (light-colored bars) and the multi-trial (dark-colored bars) univariate approach. Decoding accuracies were attained through channels-of-interest, preceded by a channel exclusion step. The upper plot show results based on analysis of HbO data (red bars), the lower plot is based on HbR data (blue bars). The ◆ symbol indicates participants whose single-trial accuracy was significant, whereas the * symbol indicates those participants whose multi-trial accuracy was significant.

