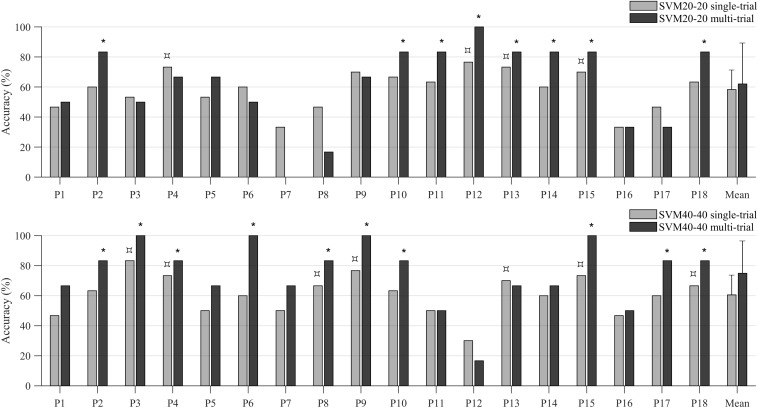
FIGURE 9.
Decoding accuracies of individual participants and the sample mean obtained with the single-trial (light-colored bars) and the multi-trial (dark-colored bars) multivariate approach. The upper plot shows decoding accuracies of the SVM20-20 classifier, the lower plot shows decoding accuracies of the SVM40-40 classifier. The  symbol indicates participants whose accuracy reached significance, as tested with permutation testing (for evaluating single-trial accuracies), whereas the * symbol indicates those participants whose multi-trial accuracy was significant. Abbreviations: SVM20-20 = support vector machine with 20 training trials of each task; SVM40-40 = support vector machine with 40 training trials of each task.

