Fig. 3.
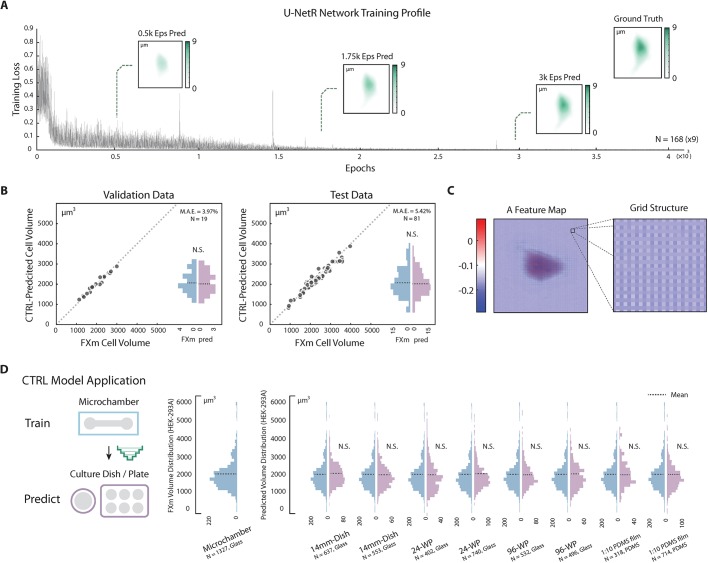
CTRL method validation and application. (A) U-NetR model training profile. Training profile of U-NetR based on training data of 1512 images (nine augmentations for each cell) on HEK-293A cells is shown with training loss progression over 80,000 training epochs. Predicted cell topography progression over the training course is shown for a representative cell at 0.5K, 1.75K and 3K epochs. Measured cell topography image (FXm data) for the cell is shown in the top-right corner. (B) CTRL model (HEK-293A) validation. Left: the trained CTRL model was applied on validation data (same microchamber, the other 20% of the cells); right: the trained CTRL model was applied on test data (cells in a different microchamber). CTRL-predicted volume is compared with FXm measured cell volume for every single cell. Volume distributions are shown as histograms. No statistical significance was found between measured volume and predicted volume. Cell number and mean absolute error (MAE) for both the validation and test cases are indicated in the top-right corner of each panel. (C) Feature maps display a grating-like structure. A representative feature map of the layer after the last up-convolutional operation in the up-sampling top level (the fourth last layer) with optical grating-like local structure is highlighted, potentially indicating that U-NetR is learning microscope optics. (D) CTRL model application across different cell culture platforms. A CTRL model trained from microchamber data can be applied to DIC cell images acquired on a variety of glass and PDMS substrates, eliminating the need for repeated FXm experiments. The only input for the CTRL model is a DIC image. HEK-293A cells were seeded in a 14 mm dish, a 24-well plate, a 96-well plate and a 1:10 PDMS membrane (two biological repeats, each biological repeat contains three technical repeats). Single-cell DIC images were inputs for the trained CTRL model. Distributions of the predicted volume in each condition are plotted in histograms, with the mean indicated by a dashed line. No statistical difference is found between the CTRL-predicted cell volume distribution and the measured volume distribution in any of the test conditions.

