Fig. 1.
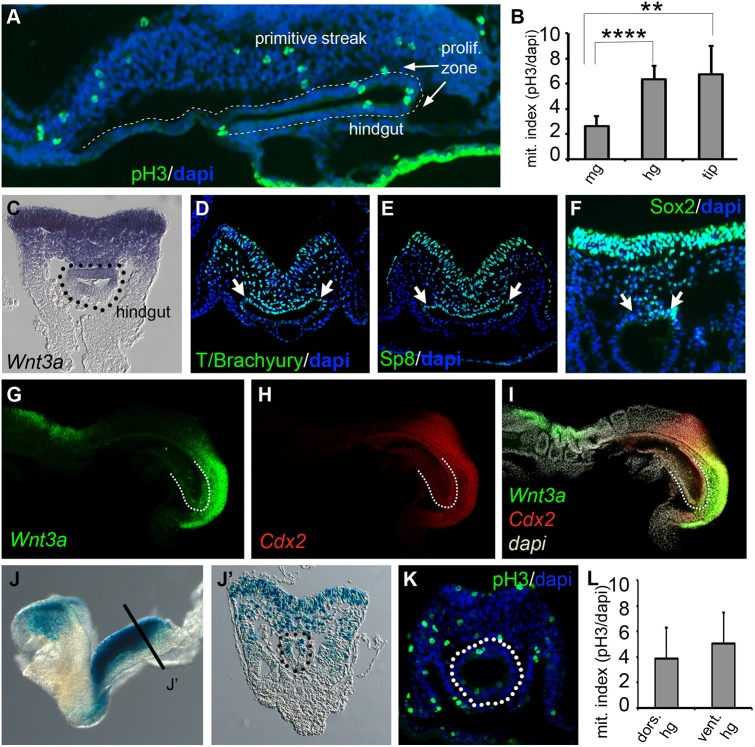
Hindgut proliferation and analysis of Wnt signaling in the E8.5 hindgut. (A) Sagittal section through the E8.5 primitive streak and hindgut showing anti-phospho-HistoneH3 labeling (green) and nuclei counterstained with DAPI (blue). The endodermal DAPI staining is outlined (dashed line) to highlight the hindgut endoderm. (B) Graph of cell proliferation in the midgut (mg), hindgut (hg) and posterior tip of the hindgut (n=5 E8.5 embryos). The hindgut epithelium showed a significantly greater mitotic index than the midgut epithelium (data are mean±s.e.m. ****P<1.2×10⁻⁴). Additionally, the posterior tip of the hindgut also showed a significantly higher number of mitotic cells than the midgut epithelium (data are mean±s.e.m. **P<7.9×10⁻³). (C) Transverse section through the PS region of an E8.5 embryo processed for whole-mount in situ hybridization and displaying Wnt3a mRNA gradient along the DV axis. (D-F) Antibody detection of T/Bra, Sp8 and Sox2 protein, respectively, in transverse sections through the PS. There is strong expression in the dorsolateral hindgut (arrows). (G-I) In situ HCR to detect the expression of Wnt3a (G,I) and Cdx2 (H,I) at E8.5. (J,J′) In situ Wnt/β-catenin reporter (BATlacZ) detected by β-galactosidase staining viewed laterally in whole-mount (J) and in transverse (J′) sections through PS and hindgut regions. (K) Transverse section through the PS and hindgut (dotted circle) stained for phospho-Histone H3 using antibody (green) with DAPI nuclear counterstain (blue). (L) Graph of mitotic indexes in dorsal and ventral hindgut (n=5, E8.5 embryos). No significant difference was observed.

