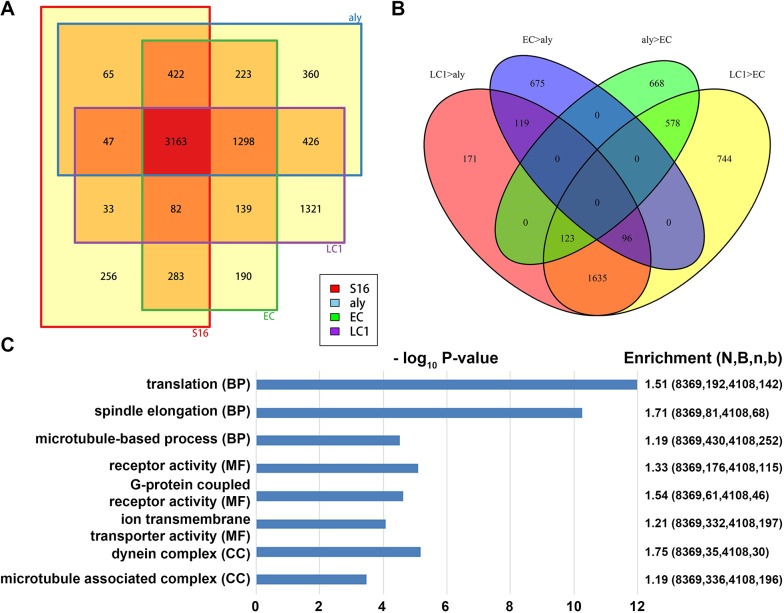
Fig. 5.
Transcriptome changes among different early and late spermatocyte samples during spermatocyte maturation. (A) Venn diagrams display the overlapping number of expressed genes in three different spermatocyte staged samples (i.e. aly mutant, EC and LC samples) versus the S16 cyst sample. (B) Venn diagram among different groups of stage-enriched genes, see main text. (C) Three classes of GO analysis results (BP, biological process; MF, molecular function; CC, cellular component) of late spermatocyte-enriched genes, immediately before the onset of the meiotic division and terminal differentiation process known as spermiogenesis. Here, based on a negative binomial model: N, total gene number of the study; B, number of N in each category of interest; n, the total number of differentially expressed genes; b, the number of n in each category.

