Fig. 6.
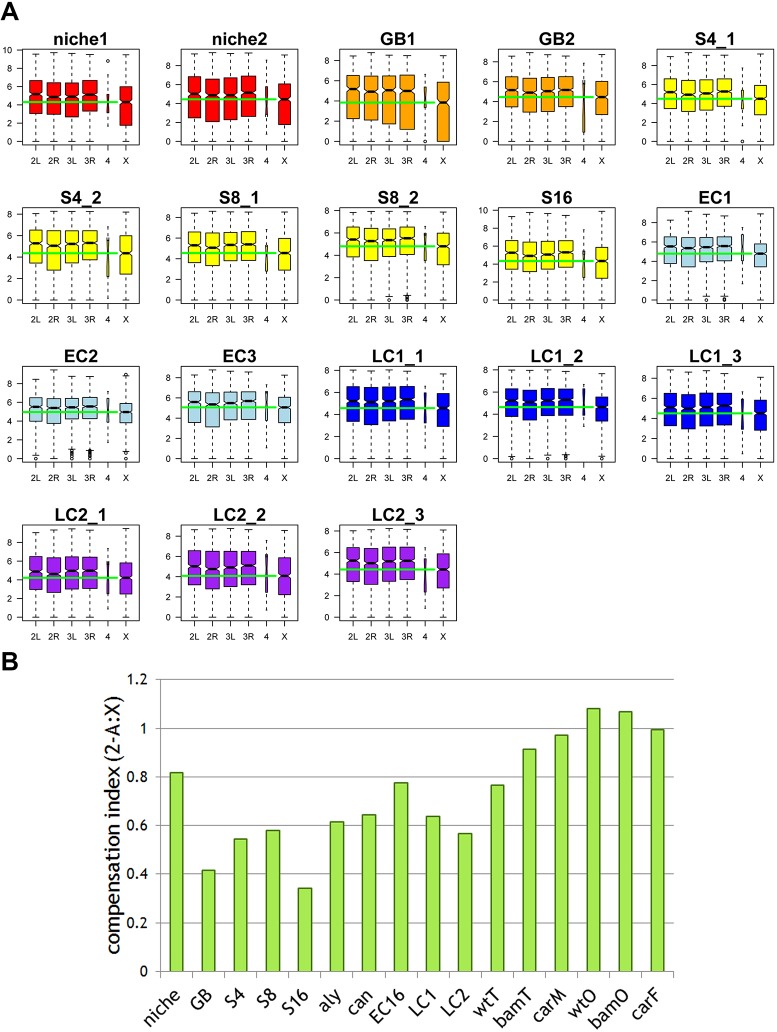
Lack of evidence for dosage compensation in germline cysts at individual stages throughout Drosophila spermatogenesis. (A) Analysis of non-sex-biased and non-stage-biased genes in all of the staged samples containing mitotic germ cells (N, GB, S4, S8 and S16) and meiotic cyst (EC and LC). The expression levels of genes located on each chromosome arm (2L/2R/3L/3R/4/X) is as follows. For the x-axis: 2L and 2R denote the left and the right arm of the second chromosome, respectively. 3L and 3R denote the left and the right arm of the third chromosome, respectively. 4 denotes the fourth chromosome, while X denotes the X chromosome. The y-axis represents the log2cRPKM value. The box plots are generated using the R Boxplot default setting: box represents the 25th and 75th percentiles, with the 50th percentile is shown as a black bar. The upper and lower whiskers are defined using the default setting of the R Boxplot function. Green bars mark the median level of X chromosomal gene expression. (B) Compensation index (CI) with the average expression level from X chromosome as well as other autosomes showing a higher degree of dosage compensation for the wild-type niche sample compared with other germline cyst samples, including wild-type GB, S4, S8, S16 spermatogonial cysts, aly and can mutant spermatocyte cysts, as well as wild-type EC16, LC1 and LC2 cysts. The wild-type testis (wtT) sample also shows low dosage compensation, whereas bam mutant testis (bamT) sample and wild-type male carcassed (carM) show more dosage compensation. Here, wild-type ovary (wtO), bam mutant ovary (bamO) and wild-type female carcassed (carF) samples are shown as controls. CT=1 indicates full compensation, whereas CT=0 indicates complete loss of dosage compensation.

