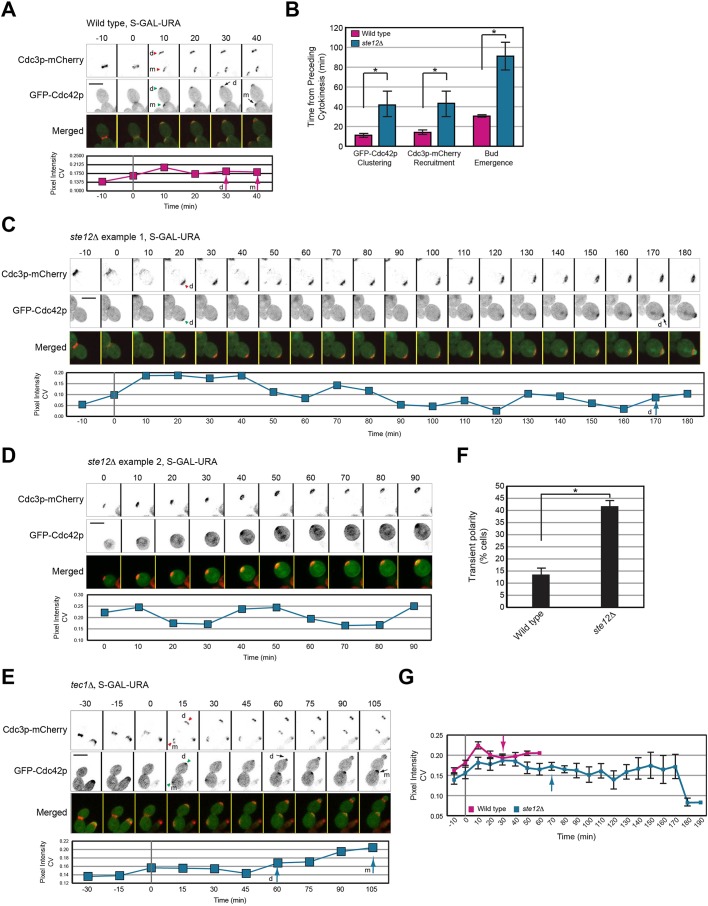
Fig. 4.
Role of the fMAPK pathway in regulating bud emergence during filamentous growth. (A) Inverted maximum intensity projection of GFP-Cdc42p clustering and bud emergence in wild-type cells in GAL. Cdc3p-mCherry was used as a marker for cell cycle progression. Septin hourglass split into double ring was set as time 0. Green arrowheads, first visible cluster of GFP-Cdc42p. Red arrowheads, recruitment of Cdc3p-mCherry at incipient sites. Arrows mark bud emergence. Graph represents GFP-Cdc42p intensity over time measured as coefficient of variance (CV) of pixel intensity of the entire cell. Arrow, timing of bud emergence. Scale bar, 5 μm. m, mother cell; d, daughter cell. (B) Quantitation of the timing of GFP-Cdc42p clustering, Cdc3p-mCherry recruitment and bud emergence in wild-type cells and ste12Δ cells grown on semi-solid S-GAL-URA medium. Error bars represent s.e.m.; *P<0.05. (C) Same as in panel 4A, except that the ste12Δ mutant was examined. (D) Same as panel 4C, except that t=0 represents start of experiment. Time points for the preceding cell cycle were not available for this cell. (E) Same as panel 4A, except that the tec1Δ mutant was examined. (F) Cells showing transient disappearance of the polarity complex (expressed as a percentage of the total cells) based on co-localization of GFP-Cdc42p and Cdc3p-mCherry in cells from panel 4B. Error bar represents s.e.m. of 17 cells. *P<0.01. (G) GFP-Cdc42p intensity over time measured as pixel intensity CV for indicated strains from panel 4B. Error bars represent the s.e.m.

